12 Customer Segmentation Examples That Drive Real Results
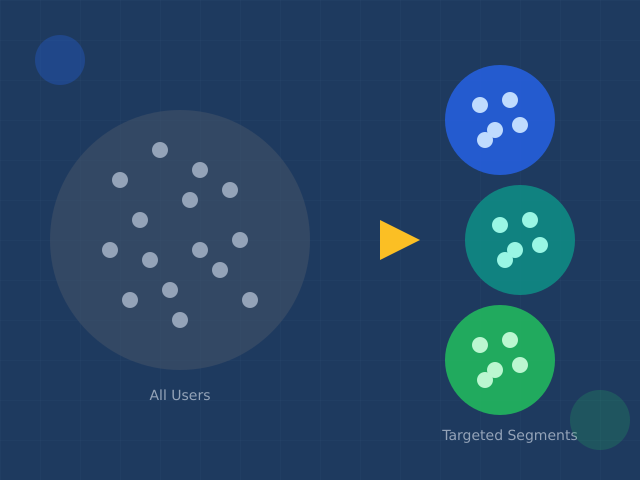
Generic marketing wastes budget. Customer segmentation fixes that by grouping buyers with shared characteristics—then targeting each group with relevant offers. The difference in results is substantial: segmented campaigns drive 760% more revenue than one-size-fits-all approaches.
But knowing you should segment isn’t the same as knowing how. This guide walks through 12 proven customer segment examples with real-world applications, showing exactly how leading brands use each type to increase conversions, retention, and lifetime value.
Why Customer Segmentation Matters
The business case for segmentation is clear:
| Metric | Impact | Source |
|---|---|---|
| Revenue from segmented email | +760% vs. non-segmented | Campaign Monitor |
| Customer retention improvement | +62% of businesses report gains | Twilio 2023 |
| Repeat purchase rate | +56% with personalization | Segment |
| Marketing ROI | 77% comes from targeted campaigns | DMA |
Segmentation works because relevance drives response. A first-time visitor needs different messaging than a loyal customer. A price-sensitive buyer responds to different offers than a premium buyer. Treating them the same means optimizing for no one.
Related: Audience Segmentation: Complete Guide covers the strategic framework behind these tactical examples.
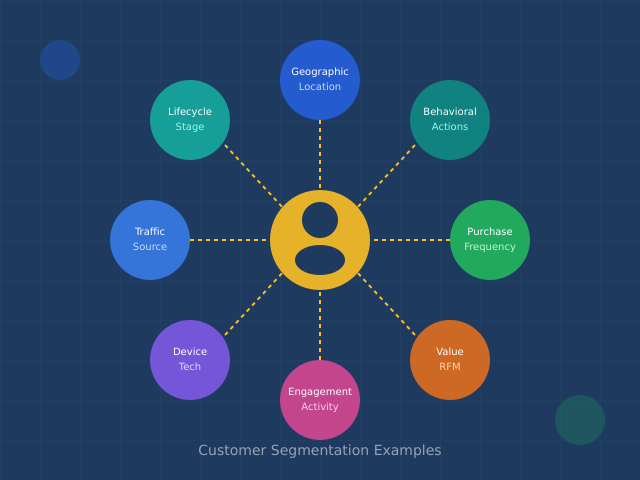
12 Customer Segment Examples That Drive Results
Each segment type serves different purposes. The most effective strategies combine multiple types based on business goals.
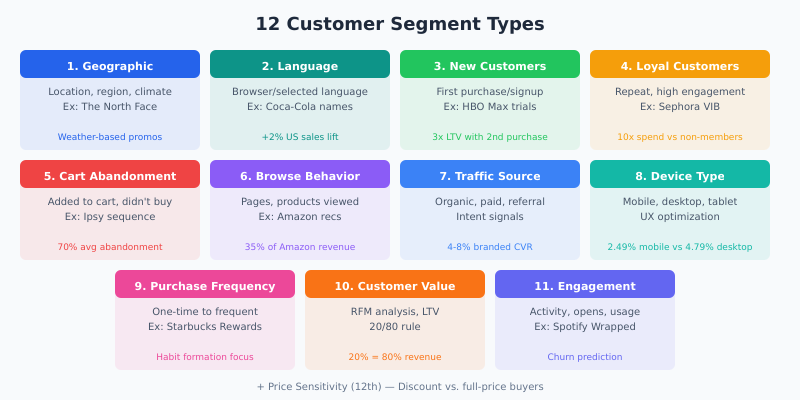
1. Geographic Location Segments
What it is: Grouping customers by country, region, city, or climate zone.
Real example: The North Face adjusts product recommendations based on local weather. Users in Colorado see ski jackets and hiking gear; users in Miami see lightweight rain shells and water-sport accessories. This isn’t just personalization—it’s inventory optimization that reduces mismatched promotions.
| Geographic Signal | Marketing Application |
|---|---|
| Climate zone | Seasonal product recommendations |
| Urban vs. rural | Delivery options, store pickup messaging |
| Time zone | Email send time optimization |
| Regional events | Local promotions, sports team tie-ins |
| Regulatory region | GDPR/CCPA compliance messaging |
Implementation: Most analytics tools capture location automatically. Create segments for your top 5-10 regions by revenue, then test location-specific messaging against generic campaigns.
2. Language Preference Segments
What it is: Grouping by browser language setting or explicitly selected language preference.
Real example: Coca-Cola’s “Share a Coke” campaign printed popular names on bottles—but different names in different countries. Maria in Spain, Mehmet in Turkey, Chen in China. The campaign generated a 2% increase in US sales after a decade of declining revenue, with even stronger results in markets with localized names.
Beyond translation: Language segmentation isn’t just about translating content. It signals cultural context:
- Date formats (MM/DD vs. DD/MM)
- Currency display preferences
- Cultural references in copy
- Image selection (diverse representation)
- Payment method preferences (credit cards vs. bank transfers vs. mobile payments)
3. New Customer Segments
What it is: Users who recently made their first purchase or signed up.
Real example: HBO Max offers heavily discounted first-month trials to new subscribers. But the real strategy is the onboarding sequence: personalized content recommendations based on initial viewing, “continue watching” prompts, and household profile setup. The goal isn’t the trial conversion—it’s reducing the 30-day churn spike common in subscription services.
| New Customer Goal | Tactic | Benchmark |
|---|---|---|
| First-week engagement | Onboarding email sequence | 40-60% open rate |
| Feature discovery | Guided product tours | 25% completion rate |
| Second purchase | Related product recommendations | 27% of new customers within 30 days |
| Account completion | Profile completion incentives | 65% completion with incentive |
Key metric: Time to second purchase. Customers who make a second purchase within 30 days have 3x higher lifetime value than those who don’t.
4. Loyal Customer Segments
What it is: Repeat buyers who consistently choose your brand over alternatives.
Real example: Sephora’s Beauty Insider program segments customers into three tiers based on annual spend: Insider (free), VIB ($350+), and Rouge ($1,000+). Each tier unlocks progressively better benefits—early access to sales, free shipping, exclusive products. Rouge members spend 10x more annually than non-members.
| Loyalty Tier | Recognition Strategy | Expected Impact |
|---|---|---|
| Entry (1-2 purchases) | Thank you messaging, loyalty program invite | +15% repeat rate |
| Developing (3-5 purchases) | Status recognition, early access | +25% AOV |
| Established (6+ purchases) | VIP treatment, exclusive offers | +40% retention |
| Advocates (high NPS + referrals) | Ambassador programs, co-creation | 3-5 referrals per advocate |
Warning: Don’t discount loyal customers. They’ve already proven willingness to pay full price. Discounting trains them to wait for sales and erodes margin on your most valuable segment.
5. Cart Abandonment Segments
What it is: Users who added items to cart but didn’t complete purchase.
The scale of the problem: Baymard Institute research shows an average cart abandonment rate of 70.19% across industries. On mobile, it’s even worse—85% in some studies.
Real example: Ipsy, the beauty subscription service, sends a three-email abandonment sequence: reminder at 1 hour, product benefits at 24 hours, and a small discount at 72 hours. The sequence recovers 12% of abandoned carts—compared to 3% with a single reminder email.
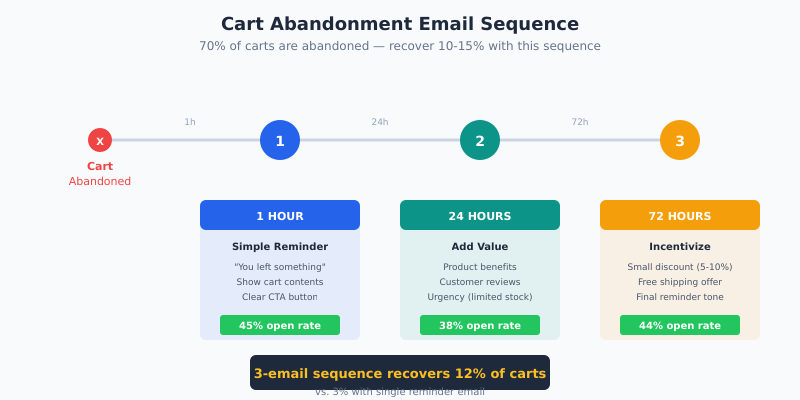
| Abandonment Email | Timing | Content Focus | Expected Open Rate |
|---|---|---|---|
| Email 1 | 1 hour | Simple reminder, cart contents | 45% |
| Email 2 | 24 hours | Product benefits, reviews, urgency | 38% |
| Email 3 | 72 hours | Incentive (free shipping or small discount) | 44% |
Sub-segmentation opportunity: Not all abandoners are equal. Segment by cart value—high-value abandoners might warrant phone outreach or larger incentives. Segment by abandonment point—users who left at shipping calculation have different objections than those who left at payment.
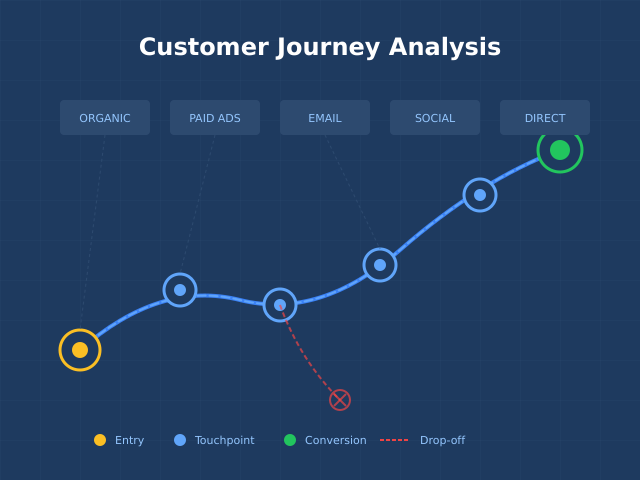
6. Browse Behavior Segments
What it is: Users grouped by pages visited, products viewed, content consumed, or features explored.
Real example: Amazon’s recommendation engine analyzes browsing patterns to power “Customers who viewed this also viewed” and “Recommended for you” sections. This isn’t just helpful—it drives 35% of Amazon’s total revenue according to McKinsey analysis.
| Browse Signal | Segment Implication | Marketing Action |
|---|---|---|
| Viewed product 3+ times | High interest, needs push | Price drop alert, scarcity messaging |
| Viewed category repeatedly | In-market for category | Category-specific retargeting |
| Read comparison content | Evaluation phase | Competitive positioning, case studies |
| Visited pricing page | Purchase intent | Sales outreach, demo offer |
| Searched specific term | Active need | Search-triggered email campaigns |
Related: Conversion Funnel Analysis shows how to identify where browse-to-purchase conversion breaks down.
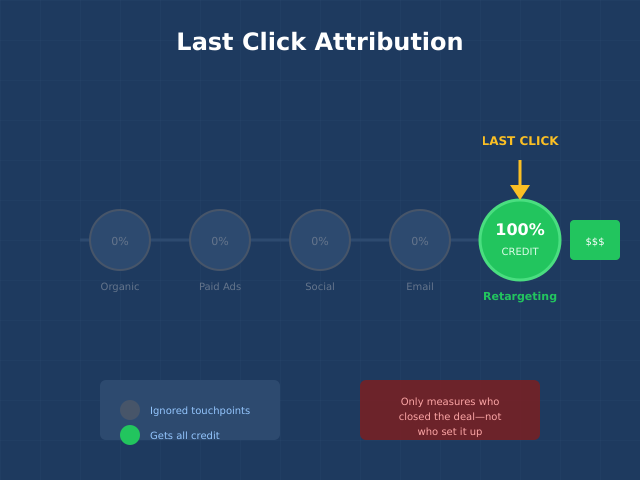
7. Traffic Source Segments
What it is: Grouping users by how they arrived—organic search, paid ads, social media, email, referral, or direct.
Why it matters: Traffic sources signal intent and expectations. Someone clicking a discount ad expects to see discounts. Someone arriving from an educational blog post expects information, not a hard sell.
| Traffic Source | Typical Intent | Landing Page Strategy | Avg. Conversion Rate |
|---|---|---|---|
| Branded search | High intent, knows brand | Direct to product/pricing | 4-8% |
| Non-branded search | Problem-aware, evaluating | Educational content first | 2-4% |
| Paid social | Interrupted, curious | Compelling hook, social proof | 1-3% |
| Existing relationship | Personalized, continues conversation | 3-6% | |
| Referral | Trust transferred | Acknowledge referral source | 3-5% |
Implementation: Use UTM parameters consistently. Create segment-specific landing pages for your highest-volume traffic sources. Test whether source-matched messaging outperforms generic pages.
8. Device Type Segments
What it is: Grouping by device—desktop, mobile, or tablet.
The mobile gap: Mobile users browse more but convert less. Average mobile conversion rates are 2.49% compared to 4.79% on desktop (Statista). This gap represents massive opportunity—or massive friction.
| Device Behavior | Optimization Priority |
|---|---|
| Mobile browsers, desktop converters | Cross-device tracking, save cart functionality |
| Mobile-only users | Streamlined checkout, mobile payment options |
| Tablet users (often evening) | Rich media, longer content formats |
| Desktop power users | Advanced features, detailed comparisons |
Action: Analyze your mobile vs. desktop funnel separately. Where does mobile conversion drop relative to desktop? That’s your friction point.
9. Purchase Frequency Segments
What it is: Grouping by how often customers buy—one-time, occasional, regular, or frequent.
Real example: Starbucks Rewards segments members by visit frequency. Infrequent visitors receive aggressive offers (double stars, free items) to increase visits. Frequent visitors receive recognition and convenience features (order ahead, no wait) rather than discounts.
| Frequency Segment | Definition | Primary Goal | Tactic |
|---|---|---|---|
| One-time buyers | Single purchase only | Second purchase | Related product recommendations |
| Occasional (2-3/year) | Infrequent purchases | Increase frequency | Subscription offers, reminders |
| Regular (monthly) | Consistent buyers | Increase basket size | Bundle offers, cross-sell |
| Frequent (weekly+) | Heavy users | Retention, advocacy | VIP treatment, referral program |
Key insight: Moving a customer from occasional to regular often generates more value than acquiring a new customer. Focus retention efforts on the “occasional” segment—they’ve proven willingness to buy but haven’t formed a habit yet.
10. Customer Value Segments
What it is: Grouping by revenue contribution—typically using RFM (Recency, Frequency, Monetary) analysis or predicted lifetime value.
The math: In most businesses, 20% of customers generate 80% of revenue. But many companies treat all customers equally, spreading marketing budget uniformly instead of concentrating on high-value segments.
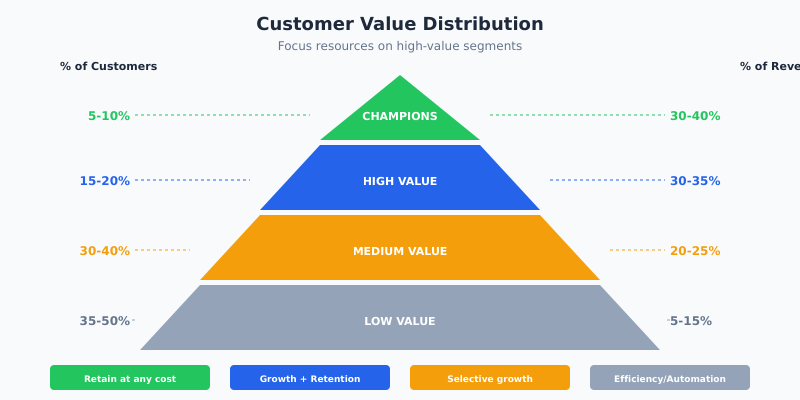
| Value Tier | % of Customers | % of Revenue | Investment Priority |
|---|---|---|---|
| Champions | 5-10% | 30-40% | Retention at any cost |
| High value | 15-20% | 30-35% | Growth and retention |
| Medium value | 30-40% | 20-25% | Selective growth |
| Low value | 35-50% | 5-15% | Efficiency, automation |
Related: Audience Segmentation Guide includes detailed RFM matrix implementation.
11. Engagement Level Segments
What it is: Grouping by interaction intensity—email opens, app sessions, feature usage, content consumption.
Real example: Spotify Wrapped isn’t just a marketing campaign—it’s engagement segmentation in action. Users who listened to 10,000+ minutes get different content than casual listeners. Heavy users receive validation; light users receive re-engagement prompts highlighting what they missed.
| Engagement Level | Signals | Strategy |
|---|---|---|
| Highly engaged | Daily active, opens emails, uses features | Advanced features, beta access, advocacy |
| Moderately engaged | Weekly active, selective engagement | Feature discovery, use case expansion |
| Low engagement | Monthly or less, limited interaction | Re-engagement campaigns, value reminders |
| Dormant | No recent activity | Win-back offers, sunset warnings |
Warning sign: Declining engagement precedes churn. Build segments that trigger when engagement drops—catching customers before they leave costs less than winning them back after.
12. Price Sensitivity Segments
What it is: Grouping by response to pricing—discount buyers, full-price buyers, and premium buyers.
How to identify: Track purchase patterns around promotions. Customers who only buy during sales are price-sensitive. Customers who buy regardless of promotions are price-insensitive. This behavioral data is more reliable than survey responses.
| Price Segment | Behavior Pattern | Strategy |
|---|---|---|
| Discount-driven | Buys only during sales | Targeted promotions, clearance alerts |
| Value-conscious | Compares, seeks deals but buys full-price | Value messaging, bundle offers |
| Convenience-driven | Buys when needed, price secondary | Availability, speed, service focus |
| Premium buyers | Prefers premium options | Quality messaging, exclusive products |
Strategic implication: Stop training full-price buyers to wait for discounts. Exclude recent full-price purchasers from promotional emails. Reserve discounts for price-sensitive segments and acquisition campaigns.
Common Segmentation Mistakes
Mistake 1: Segments Without Strategy
Creating segments you never act on wastes analytical effort. Every segment needs a corresponding strategy: what will you do differently for this group? If the answer is “nothing,” delete the segment.
Mistake 2: One Segmentation Dimension
Demographic-only or geographic-only segmentation misses behavioral signals that predict response. Combine dimensions: “High-value customers in urban areas who browse mobile but buy desktop” is more actionable than “customers in New York.”
Mistake 3: Treating All Abandoners the Same
A $50 cart abandoner and a $500 cart abandoner warrant different recovery investments. A first-time abandoner differs from a repeat abandoner. Sub-segment your segments for better ROI.
Mistake 4: Static Segments
Customer behavior changes. A “new customer” becomes a “loyal customer” becomes “at-risk.” Build dynamic segments that update automatically based on current behavior, not historical classifications.
Mistake 5: Discounting Loyal Customers
Your best customers already buy at full price. Sending them discount offers erodes margin without increasing purchase probability. Reserve discounts for price-sensitive segments and acquisition. Reward loyal customers with experiences, early access, and recognition—not margin destruction.
Implementation Priorities
Don’t implement all 12 segments at once. Start with highest-impact opportunities:
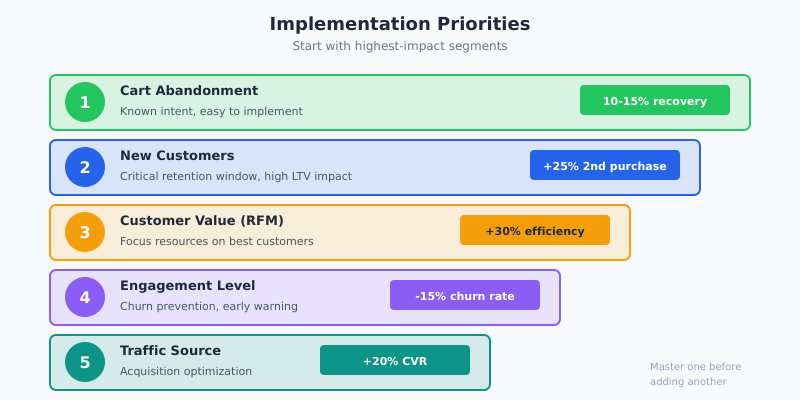
| Priority | Segment | Why Start Here | Expected Impact |
|---|---|---|---|
| 1 | Cart abandonment | Known intent, easy to implement | 10-15% recovery rate |
| 2 | New customers | Critical retention window | +25% second purchase rate |
| 3 | Customer value (RFM) | Focuses resources on best customers | +30% marketing efficiency |
| 4 | Engagement level | Churn prevention | -15% churn rate |
| 5 | Traffic source | Acquisition optimization | +20% conversion rate |
Master one segment before adding another. A well-executed cart abandonment program beats a poorly-executed program across 12 segments.
Tools for Customer Segmentation
Match tools to segmentation complexity:
Email platforms (basic segmentation):
- Mailchimp, Klaviyo, ActiveCampaign: Built-in behavioral segments, purchase history, engagement tracking
- Best for: E-commerce, straightforward B2C segmentation
Analytics platforms (behavioral insights):
- GA4: Audience builder, predictive audiences, Google Ads integration
- Mixpanel, Amplitude: Advanced behavioral cohorts, user journey analysis
- Privacy-first options: Plausible, Fathom for basic segmentation without cookies
Customer data platforms (advanced):
- Segment, mParticle: Unified profiles, real-time segmentation, cross-channel activation
- Best for: Complex customer journeys, multiple touchpoints, enterprise scale
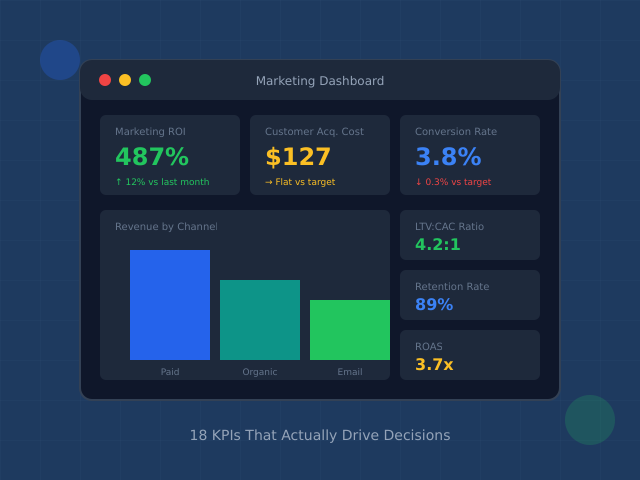
Measuring Segment Performance
Every segment needs success metrics:
| Segment Type | Primary Metric | Secondary Metrics |
|---|---|---|
| Cart abandonment | Recovery rate | Revenue recovered, time to recovery |
| New customers | Second purchase rate | Time to second purchase, onboarding completion |
| Loyal customers | Retention rate | NPS, referral rate, share of wallet |
| Value segments | Segment revenue growth | Migration rate (low→high value) |
| Engagement segments | Engagement score trend | Feature adoption, churn rate |
Compare segment performance against control groups. The goal isn’t segmentation for its own sake—it’s measurable improvement in business outcomes.
Continue Learning
- Audience Segmentation: Complete Guide — strategic framework and RFM implementation
- Conversion Funnel Analysis — identify where segments drop off
- Psychology of High-Converting Landing Pages — behavioral principles for segment-specific pages
- Digital Marketing Trends 2026 — where personalization is heading
Bottom Line
Customer segmentation transforms marketing from broadcasting to targeting. The examples above show how leading brands apply segmentation across the customer journey—from acquisition through retention.
Start with cart abandonment and new customer segments. These two alone can generate double-digit revenue improvements with straightforward implementation. Then expand to value-based and engagement segments as your capabilities mature.
The companies that win aren’t necessarily those with the most segments. They’re the ones that act on the segments they have—delivering relevant experiences that make customers feel understood, not marketed to.