Customer Journey Analysis: Map, Track, and Optimize Every Touchpoint
Companies with strong customer journey analysis see 54% greater return on marketing investment. Yet most businesses track isolated metrics—pageviews, clicks, conversions—without understanding how these interactions connect into a complete picture of customer behavior.
Customer journey analysis bridges this gap. It reveals not just what customers do, but why they move from awareness to purchase (or abandon along the way). This guide covers the framework, implementation steps, and common pitfalls to avoid.
What Customer Journey Analysis Actually Measures
Customer journey analysis tracks and analyzes how customers interact with your brand across multiple channels and touchpoints over time. Unlike single-session analytics, it connects the dots between a customer’s first interaction and their eventual conversion—or exit.
| Component | What It Tracks | Why It Matters |
|---|---|---|
| Touchpoints | Every interaction (ads, emails, website visits, support) | Identifies which channels drive engagement |
| Sequences | Order of interactions before conversion | Reveals optimal paths to purchase |
| Time gaps | Duration between touchpoints | Shows consideration period length |
| Drop-off points | Where prospects exit the journey | Pinpoints friction and lost opportunities |
| Cross-device behavior | Transitions between mobile, desktop, tablet | Ensures consistent experience across devices |
| Channel transitions | Movement between organic, paid, direct, social | Informs budget allocation |
The goal isn’t just data collection—it’s understanding the customer’s mental model. What questions do they have at each stage? What barriers stop them from progressing?
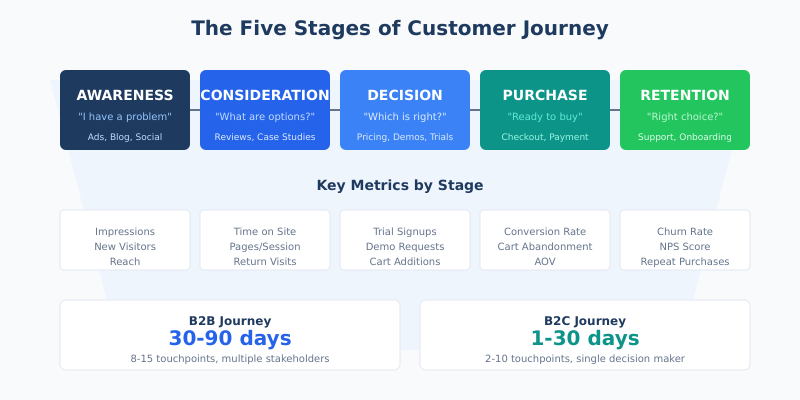
The Five Stages of Customer Journey
Every customer journey follows a general framework, though the specifics vary by industry and purchase complexity. Understanding these stages helps you identify what to measure at each point.
| Stage | Customer Mindset | Typical Touchpoints | Key Metrics |
|---|---|---|---|
| Awareness | “I have a problem” | Blog posts, social media, ads, word of mouth | Impressions, reach, new visitors |
| Consideration | “What are my options?” | Comparison pages, reviews, case studies, webinars | Time on site, pages per session, return visits |
| Decision | “Which solution is right for me?” | Pricing pages, demos, trials, sales calls | Trial signups, demo requests, cart additions |
| Purchase | “I’m ready to buy” | Checkout, payment, onboarding | Conversion rate, cart abandonment, AOV |
| Retention | “Was this the right choice?” | Support, product usage, email sequences | Churn rate, NPS, repeat purchases |
B2B journeys typically span weeks or months with multiple stakeholders. B2C journeys can happen in minutes for impulse purchases or extend for high-consideration items like cars or electronics.
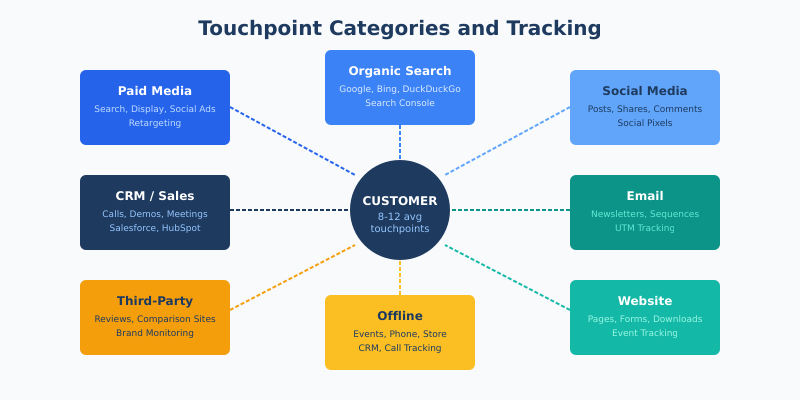
Touchpoint Categories and Tracking Methods
Before analyzing journeys, you need comprehensive touchpoint tracking. Most businesses undercount their touchpoints—a typical B2B buyer interacts with 8-12 touchpoints before purchasing.
| Category | Touchpoints | Tracking Method |
|---|---|---|
| Paid media | Search ads, display ads, social ads, retargeting | UTM parameters, ad platform pixels |
| Organic search | Google, Bing, DuckDuckGo results | Analytics referrer data, Search Console |
| Social media | Posts, shares, comments, DMs | Social pixels, UTM parameters |
| Newsletters, sequences, transactional | Email platform tracking, UTM parameters | |
| Website | Pages visited, forms, downloads, chat | Web analytics, event tracking |
| Offline | Events, phone calls, store visits | CRM integration, call tracking, surveys |
| Third-party | Reviews, comparison sites, forums | Referrer data, brand monitoring |
How to Run a Customer Journey Analysis: Step by Step
Step 1: Map Your Current Journey Hypothesis
Start with what you think happens, then validate with data. Document:
- Entry points: How do people first discover you?
- Key actions: What do they do on your site?
- Decision factors: What information do they need?
- Conversion triggers: What pushes them to act?
- Exit points: Where do they typically leave?
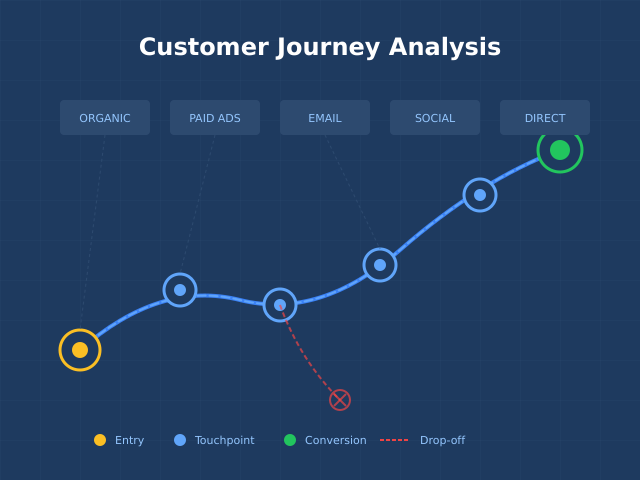
Create a visual map showing the ideal path and likely alternatives. This becomes your baseline for comparison against actual behavior data.
Step 2: Identify All Touchpoints
Audit every possible customer interaction. Common blind spots:
- Review sites (G2, Capterra, Trustpilot)
- Community forums and Reddit
- YouTube videos and podcasts
- Sales and support conversations
- Partner and affiliate referrals
For each touchpoint, determine: Can you track it? What data do you capture? How does it connect to user identity?
Step 3: Implement Cross-Channel Tracking
Unified tracking requires consistent user identification. Options include:
| Method | Pros | Cons |
|---|---|---|
| First-party cookies | Works for same-domain tracking | Lost on device/browser switch |
| User ID (logged in) | Most accurate cross-device | Requires authentication |
| Email matching | Links known to anonymous | Privacy regulations apply |
| Probabilistic matching | Works without login | Less accurate, ~70-85% |
At minimum, implement consistent UTM parameter conventions across all campaigns. Example structure:
utm_source: Platform (google, facebook, newsletter)utm_medium: Channel type (cpc, email, social)utm_campaign: Campaign nameutm_content: Ad/link variant
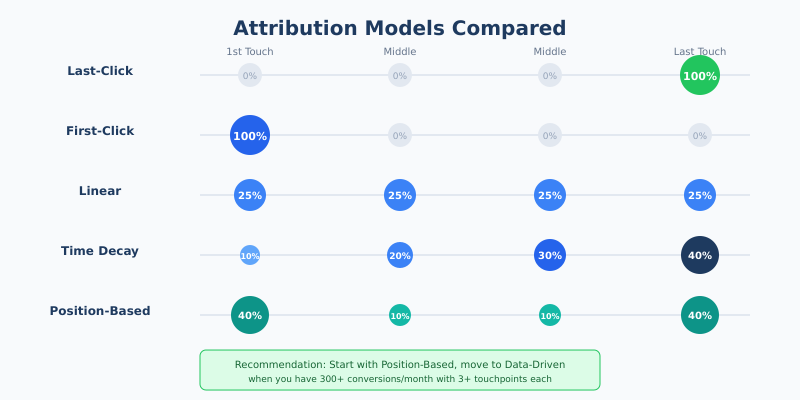
Step 4: Choose an Attribution Model
Attribution determines how credit for conversions is assigned across touchpoints. No model is perfect—each reveals different insights.
| Model | How It Works | Best For | Limitation |
|---|---|---|---|
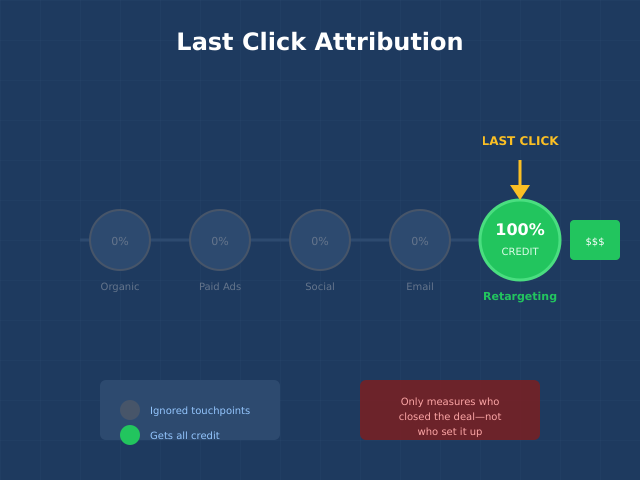
| Last-click | 100% credit to final touchpoint | Short sales cycles | Ignores awareness channels |
| First-click | 100% credit to first touchpoint | Brand awareness focus | Ignores conversion drivers |
| Linear | Equal credit to all touchpoints | Balanced view | Doesn’t reflect actual influence |
| Time decay | More credit to recent touchpoints | Longer sales cycles | Undervalues initial discovery |
| Position-based | 40% first, 40% last, 20% middle | Most customer journeys | Arbitrary weight distribution |
| Data-driven | ML-based on actual conversion patterns | High-volume sites | Needs significant data |
Recommendation: Start with position-based attribution, then move to data-driven once you have 300+ conversions monthly with 3+ touchpoints each.
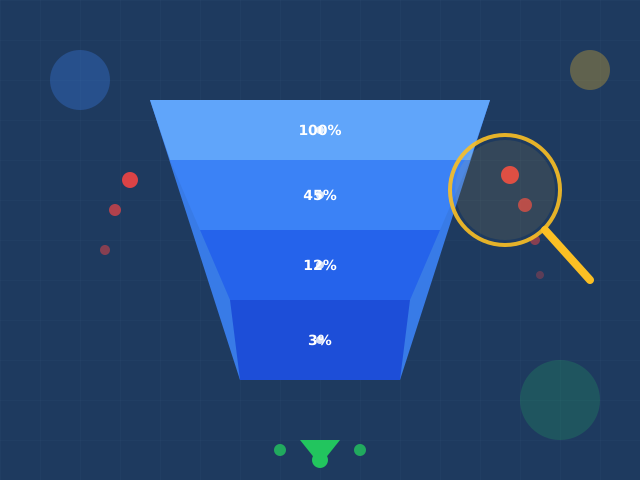
Step 5: Analyze Funnel Drop-offs
Use funnel reports to identify where visitors exit. For each stage, calculate:
Stage Conversion Rate = (Users completing stage ÷ Users entering stage) × 100
Benchmark drop-off rates vary by industry, but typical patterns:
| Funnel Stage | Average Drop-off | Top Performers | Red Flag |
|---|---|---|---|
| Homepage → Product page | 55-65% | 40-50% | >75% |
| Product → Add to cart | 70-80% | 55-65% | >85% |
| Cart → Checkout start | 40-50% | 25-35% | >60% |
| Checkout → Purchase | 20-30% | 10-15% | >40% |
Focus optimization efforts on stages with the highest drop-off rates relative to benchmarks—that’s where you’ll find the biggest gains.
Step 6: Investigate Why Visitors Don’t Convert
Quantitative data shows where people drop off. Qualitative research reveals why.
Methods to understand non-conversion:
- Form analytics: Which fields cause abandonment?
- Session recordings: Watch actual user behavior
- Heatmaps: Where do users click and scroll?
- Exit surveys: Ask directly why they’re leaving
- User interviews: Deep-dive with target customers
Common non-conversion reasons by journey stage:
| Stage | Common Exit Reasons |
|---|---|
| Awareness | Content doesn’t match search intent, slow page load |
| Consideration | Missing information, unclear differentiation, no social proof |
| Decision | Price concerns, missing features, no trial option |
| Purchase | Complex checkout, unexpected costs, trust concerns |
Step 7: Test and Optimize
Turn insights into experiments. For each identified friction point:
- Hypothesize: “If we [change X], then [metric Y] will improve because [reason Z]”
- Prioritize: Score by potential impact, confidence, and effort
- Test: A/B test with sufficient sample size
- Analyze: Statistical significance at 95% confidence minimum
- Implement: Roll out winning variants
- Document: Record learnings for future reference
Don’t test everything at once. Focus on one stage of the journey until you’ve made meaningful improvements, then move to the next.
Customer Journey Benchmarks by Industry
Journey length and complexity vary significantly by industry. Use these benchmarks to set expectations.
| Industry | Avg. Touchpoints | Avg. Journey Length | Primary Channels |
|---|---|---|---|
| B2B Software | 8-15 | 30-90 days | Content, email, sales |
| B2B Services | 6-12 | 14-60 days | Referral, content, sales |
| E-commerce (low AOV) | 2-4 | 1-7 days | Paid ads, organic, email |
| E-commerce (high AOV) | 5-10 | 14-30 days | Organic, reviews, retargeting |
| SaaS | 6-12 | 7-30 days | Content, trial, email |
| Financial Services | 10-20 | 30-180 days | Content, comparison, sales |
| Healthcare | 8-15 | 14-90 days | Search, referral, content |
Source: Gartner B2B Buying Journey Research, Salesforce State of the Connected Customer
Common Mistakes in Customer Journey Analysis
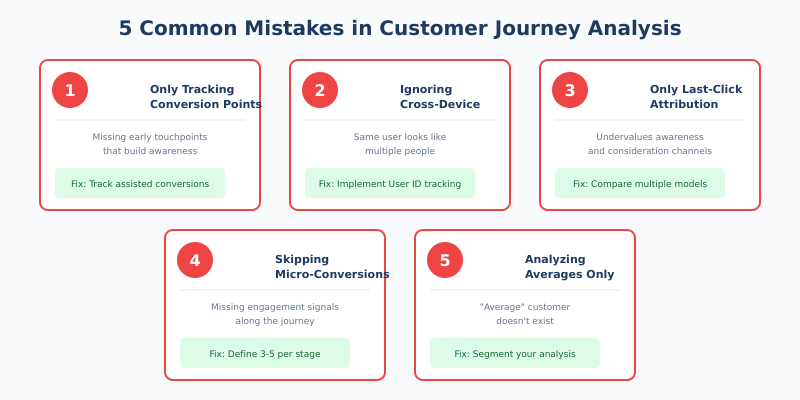
Mistake 1: Focusing Only on Conversion Touchpoints
Many businesses only track the final steps before purchase—pricing page visits, demo requests, checkout starts. This misses the crucial early touchpoints that build awareness and consideration.
Why it hurts: You’ll undervalue top-of-funnel channels like content marketing and brand advertising. Budget gets shifted to bottom-funnel activities, eventually starving your pipeline.
Fix: Track engagement metrics at every stage. A blog reader today is a qualified lead next month. Measure assisted conversions, not just last-click.
Mistake 2: Ignoring Cross-Device Journeys
A customer researches on mobile during commute, compares options on work laptop, and purchases from home desktop. Without cross-device tracking, this looks like three different people.
Why it hurts: You’re overcounting users, misattributing conversions, and missing the complete picture. Mobile might show high bounce rates but actually drive research that converts elsewhere.
Fix: Implement user ID tracking for logged-in users. Use probabilistic matching for anonymous users. At minimum, analyze device category trends separately.
Mistake 3: Using Only Last-Click Attribution
Last-click is the default in most analytics tools, but it dramatically undervalues awareness and consideration touchpoints. The ad that introduced your brand gets zero credit.
Why it hurts: Brand campaigns and content marketing appear to have zero ROI. Money flows to retargeting (which only works because other channels exist). Eventually your funnel top starves.
Fix: Compare multiple attribution models side by side. The channels that look different across models are the ones being over or undervalued by your current approach.
Mistake 4: Not Tracking Micro-Conversions
Waiting for final purchase to measure success means missing critical engagement signals along the way. Micro-conversions—newsletter signups, resource downloads, video views—indicate journey progress.
Why it hurts: You can’t optimize what you don’t measure. A campaign might generate significant consideration-stage engagement without immediate purchases. Without micro-conversion data, it looks like a failure.
Fix: Define 3-5 micro-conversions per journey stage. Track them as events in your analytics. Build dashboards showing progression through these milestones.
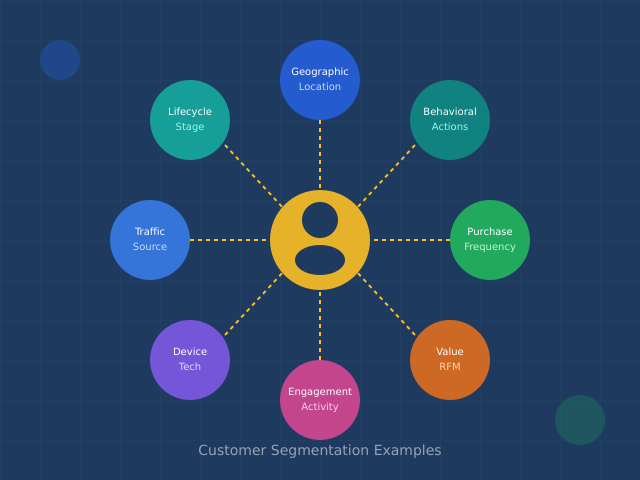
Mistake 5: Analyzing Average Journeys Instead of Segments
The “average” customer journey doesn’t exist. Different segments—enterprise vs. SMB, new vs. returning, high intent vs. browsing—follow completely different paths.
Why it hurts: Optimization based on averages improves nothing for anyone. You might speed up checkout when the real problem is enterprise buyers can’t find case studies.
Fix: Segment journey analysis by customer type, acquisition source, product interest, and company size. Look for patterns within segments, not across them. If you’re unsure how to segment, our audience segmentation guide covers the framework.
Tools for Customer Journey Analysis
Different tools excel at different aspects of journey analysis. Most organizations need a combination.
| Tool Category | Examples | Strength |
|---|---|---|
| Web analytics | Google Analytics 4, Matomo, Plausible, Adobe Analytics | Traffic patterns, funnel analysis, attribution |
| Customer data platforms | Segment, mParticle, Tealium | Cross-channel identity, data unification |
| Session recording | Hotjar, FullStory, Microsoft Clarity | Qualitative behavior insights |
| CRM | Salesforce, HubSpot, Pipedrive | Sales touchpoint tracking, lead journey |
| Attribution platforms | Dreamdata, Bizible, Attribution | Multi-touch attribution, B2B journeys |
| Journey mapping | Miro, Lucidchart, Smaply | Visual documentation, team alignment |
Minimum viable stack: Web analytics with event tracking + CRM integration + session recording tool. This covers quantitative journey data, sales touchpoints, and qualitative insights.
For privacy-focused options, see our Plausible Analytics review or learn about common mistakes when switching analytics platforms.
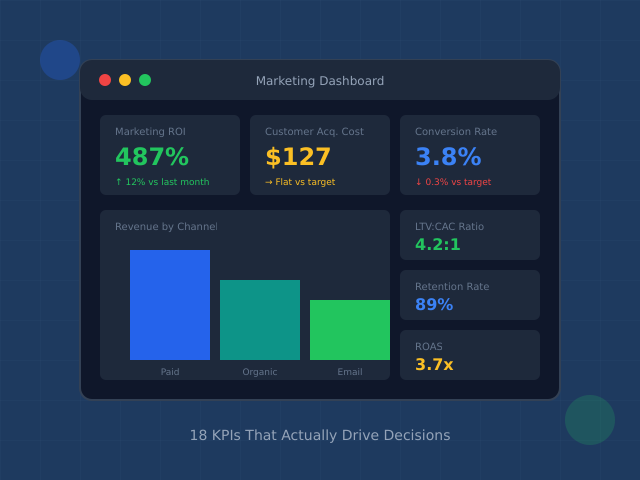
Metrics Dashboard for Journey Analysis
Build a dashboard that tracks journey health at each stage. Include both volume and quality metrics.
| Stage | Volume Metric | Quality Metric | Target Formula |
|---|---|---|---|
| Awareness | New users | Bounce rate | MoM growth >5%, Bounce <60% |
| Consideration | Return visitors | Pages/session | Return rate >25%, Pages >2.5 |
| Decision | Micro-conversions | Time to convert | Month/month growth, Decreasing trend |
| Purchase | Conversions | Conversion rate | Match industry benchmark |
| Retention | Repeat purchases | Customer lifetime value | LTV > 3× CAC |
For detailed KPI guidance, see our marketing KPIs dashboard guide.
Continue Learning
Apply journey analysis insights with these related guides:
- Conversion Funnel Analysis — detailed drop-off investigation techniques
- Customer Segmentation Examples — real-world segment strategies
- Psychology of High-Converting Landing Pages — optimize decision-stage touchpoints
- Digital Marketing Trends 2026 — where customer expectations are heading
Bottom Line
Customer journey analysis transforms scattered data points into actionable insight. The framework is straightforward: map the journey, track touchpoints, measure drop-offs, understand why, and test improvements.
Start with your highest-volume journey and work backward from conversion. Where do most people drop off? Why? Fix that first, then expand your analysis to other paths and segments.
The companies winning at customer experience aren’t guessing—they’re measuring every interaction and continuously optimizing. Your analytics setup determines whether you’re flying blind or navigating with precision.