How to Measure Content Marketing ROI With Analytics
Content marketing has a measurement problem. You publish blog posts, guides, and videos — then struggle to prove they generate revenue. The CFO asks about content marketing ROI, and the best answer you can offer is “blog traffic went up 30%.” That is not ROI. That is a vanity metric wrapped in a growth story.
Measuring content ROI is harder than measuring paid advertising ROI because content rarely converts on first touch. A prospect might read four blog posts over three months before signing up. Standard last-click attribution gives all credit to the final touchpoint and none to the content that built trust and educated the buyer. But difficult does not mean impossible — it means you need the right framework.

The Content Marketing ROI Formula
At its simplest, content marketing ROI is calculated the same way as any investment return:
Content Marketing ROI = (Revenue Attributed to Content − Cost of Content) / Cost of Content × 100
The challenge lies in accurately measuring both sides of this equation. Costs are relatively straightforward — writer fees, design costs, tool subscriptions, distribution spend, and the time your team invests. Revenue attribution is where most teams get stuck.
Calculating Content Costs Accurately
Most teams undercount content costs because they exclude internal time. A complete cost accounting includes:
- Production costs: Writer fees, editor fees, design/illustration, video production
- Internal labor: Strategy time, review cycles, project management (use hourly rate × hours)
- Distribution costs: Paid promotion, social media management, email sends
- Tool costs: CMS, SEO tools, analytics platforms, design software (allocated by usage)
- Maintenance costs: Content updates, broken link fixes, republishing
For a realistic benchmark, the average B2B blog post costs $1,500-$3,000 when internal labor is included. Enterprise-grade research reports or interactive content can run $10,000-$50,000. According to the Content Marketing Institute’s annual research, 72% of successful content marketers measure ROI, but fewer than half are confident in their measurement approach. If your cost accounting shows $200 per blog post, you are missing most of the actual costs.
Attribution Challenges for Content
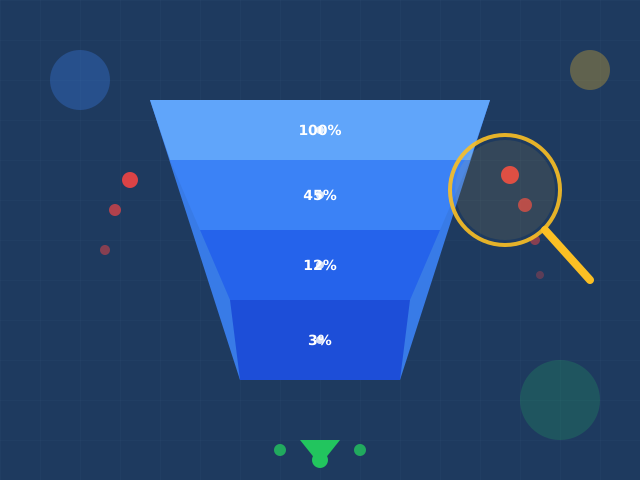
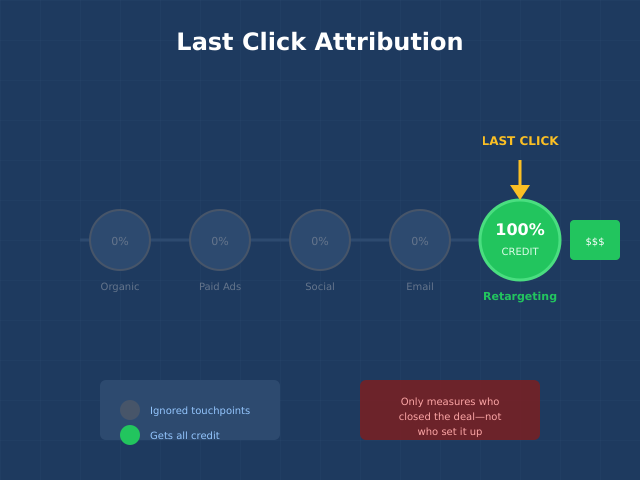
Content sits at the top and middle of the funnel. It builds awareness, educates prospects, and nurtures leads — but it rarely closes the deal. This makes last-click attribution almost useless for measuring content value. Under last-click, a prospect who read 12 blog posts before clicking a retargeting ad gives 100% credit to the ad and 0% to the content.
The solution is multi-touch attribution that distributes credit across all touchpoints in the customer journey. For content specifically, these models work best:
| Attribution Model | How It Credits Content | Best For |
|---|---|---|
| Linear | Equal credit to every touchpoint | Teams new to attribution |
| Time decay | More credit to recent touchpoints | Short sales cycles |
| Position-based (U-shaped) | 40% to first touch, 40% to last, 20% distributed | Balanced view of content’s role |
| Data-driven | ML-assigned credit based on actual conversion patterns | High-volume businesses |
Position-based attribution is the best starting point for content teams because it values both the first blog post that attracted the prospect (awareness) and the final touchpoint that converted them, while still crediting content consumed in between.
Metrics That Actually Measure Content ROI
Page views and social shares tell you about content popularity, not content effectiveness. These metrics connect content to revenue.
Assisted Conversions
In GA4, assisted conversions show how often content appeared in conversion paths without being the final click. This is the single most important metric for content ROI because it captures content’s true role: assisting the sale rather than closing it. If your blog generates 200 assisted conversions per month but only 15 last-click conversions, last-click reporting understates content’s value by 93%.
Content-Influenced Pipeline
For B2B companies, measure the total pipeline value of deals where the contact consumed at least one piece of content before entering the pipeline. This is your content-influenced pipeline. Most B2B companies find that 40-60% of their pipeline is content-influenced once they start measuring it properly.
Time to Convert
Compare the average time-to-conversion for leads who consumed content versus those who did not. If content-engaged leads convert 30% faster, that acceleration has a measurable dollar value — shorter sales cycles reduce cost per acquisition and improve cash flow.
Conversion Rate by Content Touchpoint
Track which specific content pieces appear most frequently in conversion paths. This identifies your highest-performing content assets and reveals which topics and formats drive the most revenue. Not all content is created equal — your top 10% of content likely drives 50%+ of content-influenced conversions. Understanding your conversion funnel helps identify where content makes the biggest impact.
Customer Lifetime Value by Acquisition Channel
Customers acquired through content (organic search, blog-to-email-to-demo paths) often have higher lifetime value than those acquired through paid channels. They arrived with more education about your product and stronger intent. Measure LTV by acquisition channel to capture this difference.

GA4 Setup for Content Tracking
Google Analytics 4 has the tools to measure content ROI, but they require proper configuration. Default GA4 setups track page views and sessions — not content performance. Here is how to configure GA4 for content measurement.
Step 1: Define Content Groups
Create content groupings in GA4 to categorize content by type (blog, guide, case study), topic, funnel stage, and target audience. This enables performance analysis at the category level rather than just individual pages.
- In GA4, go to Admin → Custom Definitions → Custom Dimensions
- Create a new dimension called “content_type” (scope: event)
- Create another called “content_topic” (scope: event)
- Push these values via your tag management system on page load
Step 2: Set Up Scroll Depth and Engagement Tracking
GA4’s enhanced measurement tracks scroll depth at 90%, but that single threshold is insufficient. Configure Google Tag Manager to fire events at 25%, 50%, 75%, and 100% scroll depth. This reveals whether visitors actually read your content or bounce after the introduction.
Step 3: Configure Conversion Events
Mark your revenue-generating actions as conversion events in GA4. For content measurement, these typically include:
- Newsletter signups (content-to-subscriber conversion)
- Demo requests or free trial signups
- Content downloads (gated content)
- Product page visits from content (intent signals)
- Purchase completions
Step 4: Build Content Performance Reports
Create explorations in GA4 that show content performance by your custom dimensions. The most valuable report combines page-level metrics (views, engagement rate, scroll depth) with conversion metrics (assisted conversions, direct conversions, revenue). Make sure your analytics setup is clean before relying on this data for decisions.
Content Marketing ROI Benchmarks by Industry
These benchmarks provide a reference point, but your own historical data should be the primary comparison. Industry averages mask enormous variance between companies with mature content programs and those just starting.
| Industry | Avg. Cost Per Blog Post | Avg. Organic Traffic ROI | Avg. Time to ROI | Content-Influenced Pipeline % |
|---|---|---|---|---|
| B2B SaaS | $2,000-$4,000 | 3-5x over 2 years | 6-12 months | 50-65% |
| E-commerce | $800-$2,000 | 4-8x over 2 years | 3-6 months | 30-45% |
| Financial Services | $3,000-$6,000 | 2-4x over 2 years | 9-18 months | 40-55% |
| Healthcare | $2,500-$5,000 | 2-3x over 2 years | 12-18 months | 35-50% |
| Professional Services | $1,500-$3,500 | 5-10x over 2 years | 6-12 months | 55-70% |
Note the “time to ROI” column. Content marketing is a compounding investment — early months show negative returns as you build your content library and organic rankings. According to Ahrefs research, only 5.7% of newly published pages reach the top 10 within a year. The payoff comes in year two and beyond, when your library generates traffic at near-zero marginal cost.
Content Scoring Framework
A content scoring framework assigns a numerical value to each piece of content based on its contribution to business goals. This moves your team beyond subjective quality assessments to data-driven content decisions.
Building Your Score
Define 4-6 weighted metrics that reflect your business priorities. Here is a starting framework:
| Metric | Weight | Scoring Criteria |
|---|---|---|
| Organic traffic | 20% | Monthly sessions (0-10 scale based on your traffic distribution) |
| Engagement rate | 15% | GA4 engagement rate relative to site average |
| Assisted conversions | 30% | Number of conversion paths this content appears in |
| Direct conversions | 20% | Last-click conversions attributed to this content |
| Backlinks | 15% | Number of referring domains |
Each content piece receives a composite score out of 100. Use this score to decide which content to promote, update, or retire. Content in the top 20% deserves more distribution investment. Content in the bottom 20% should be audited — can it be improved, merged with similar content, or removed?
Content Decay Detection
Track content scores monthly to identify decay — content that was once high-performing but is losing traffic and conversions. This is a leading indicator that the content needs updating. Proactive content refreshes are far more efficient than writing new content from scratch. HubSpot data shows that updating and republishing old blog posts can increase organic traffic to those posts by up to 106%.
Connecting Content to Revenue: A Practical Workflow
Theory is useful, but implementation is what matters. Here is a step-by-step workflow for connecting content to revenue in your analytics.
- Tag all content with UTM parameters when distributing via email, social, or paid channels. This ensures GA4 can attribute traffic to specific distribution efforts.
- Implement first-party tracking. Use server-side tracking alongside client-side analytics to capture the full picture without relying on third-party cookies.
- Map the customer journey. Use customer journey analysis to understand where content fits in your typical conversion paths.
- Connect your CRM. Import GA4 data into your CRM (or vice versa) to link anonymous content consumption to known deals and revenue.
- Build a content attribution dashboard. Create a single view that shows content performance across the full funnel: awareness metrics, engagement metrics, and revenue metrics.
- Review monthly. Content ROI measurement is not a set-and-forget activity. Review your dashboard monthly, update your content scores, and adjust strategy based on what the data reveals.
Common Mistakes
These measurement errors lead teams to either overvalue or undervalue their content marketing investment — both of which result in poor resource allocation.
1. Measuring Content With Last-Click Attribution Only
This is the most common and most damaging mistake. Content almost never converts on last click. If your attribution model only counts last-click conversions, your content will always look like it underperforms, and your paid channels will always look like they overperform. You need multi-touch attribution — period.
2. Reporting Traffic Instead of Business Outcomes
Traffic is an input, not an outcome. A blog post with 50,000 monthly visitors and zero conversions has generated zero ROI. A post with 2,000 visitors and 50 demo requests has generated significant pipeline value. Always report content performance in terms of business outcomes: leads, pipeline, revenue. Track the KPIs that actually matter.
3. Ignoring Content Maintenance Costs
Content is not a one-time investment. Statistics go stale, screenshots need updating, product features change, and competitors publish better content. If you calculate ROI based only on initial production costs, you overstate the return. Include ongoing maintenance in your cost calculations.
4. Measuring Too Early
Content marketing ROI is negative for the first 3-6 months in almost every program. Declaring content marketing “doesn’t work” after 90 days is like planting a tree and complaining there is no shade after a week. Set realistic time horizons — 12 months minimum for a fair assessment of SEO-driven content.
5. Not Segmenting by Content Type
Averaging ROI across all content types masks critical differences. Your case studies might deliver 10x ROI while your thought leadership pieces deliver 1.5x. Segmenting by type, topic, and funnel stage reveals where to invest more and where to cut back.
Continue Learning
Deepen your content measurement capabilities with these related resources:
- Conversion Funnel Analysis: Find Where You Lose Customers
- Multi-Touch Attribution Models: How to Choose the Right One
- Last-Click Attribution: Why It’s Misleading and What to Use Instead
- Customer Journey Analysis: Map, Track, and Optimize Every Touchpoint
- 18 Marketing KPIs Worth Tracking and 5 Metrics to Skip
Bottom Line
Content marketing ROI is measurable — but not with the same tools and methods you use for paid advertising. You need multi-touch attribution to capture content’s role in the customer journey, proper cost accounting that includes internal labor, and metrics that connect content consumption to revenue rather than traffic.
Start by implementing assisted conversion tracking in GA4 and building a content scoring framework. These two actions alone will transform how you evaluate and optimize your content investment. Then progressively add CRM integration, content-influenced pipeline tracking, and LTV-by-channel analysis as your measurement maturity grows.
The companies that master content ROI measurement have a structural advantage: they know exactly which content investments generate returns and which do not. That clarity enables them to outinvest competitors in what works and cut what doesn’t — compounding their content advantage over time.