Website Traffic Analysis: A Framework for Actionable Insights
Most companies look at their traffic numbers daily. Very few extract actionable insights from them. Website traffic analysis is not about watching a line go up or down — it is about understanding why visitors arrive, what they do, and whether their behavior leads to business outcomes.
The difference between data and insight is a framework. Without one, you are staring at dashboards hoping patterns emerge. With one, you know exactly where to look, what questions to ask, and which metrics justify action versus which ones you safely ignore.
This guide provides that framework. It covers the full analysis cycle from acquisition through behavior to conversion, with industry benchmarks, segmentation strategies, and a clear process for separating actionable patterns from vanity metrics.

The Traffic Analysis Framework: Acquisition → Behavior → Conversion
Effective traffic analysis follows a three-stage framework that mirrors how visitors interact with your site. Each stage has its own metrics, questions, and optimization levers.
Stage 1: Acquisition — Where Do Visitors Come From?
Acquisition analysis answers the foundational question: which channels send traffic, and what is the quality of that traffic? A channel that sends 50,000 visitors who bounce immediately is less valuable than one that sends 5,000 visitors who convert at 4%.
Key acquisition metrics:
- Sessions by channel: Organic search, paid search, social, referral, direct, email
- New vs. returning visitor ratio: Indicates whether you are growing your audience or relying on the same base
- Channel-specific engagement rate: GA4’s engagement rate by source reveals traffic quality at a glance
- Cost per visit (paid channels): What you pay for each session from paid sources
The most important insight at this stage is channel efficiency. Compare the engagement rate and conversion rate of each channel, not just the volume. A channel with 2% of your traffic but 15% of your conversions deserves more investment than one with 30% of traffic and 3% of conversions.
Be careful with your channel definitions. GA4’s default channel groupings work for most businesses, but misconfigured UTM parameters can misattribute traffic. An analytics audit often reveals that 10-20% of traffic is misclassified — usually in the “direct” or “unassigned” buckets.
Stage 2: Behavior — What Do Visitors Do on Your Site?
Behavior analysis reveals whether your content and user experience match visitor intent. High traffic with poor engagement signals a mismatch between what visitors expect and what they find.
Key behavior metrics:
- Engagement rate: Percentage of sessions that lasted 10+ seconds, had 2+ page views, or triggered a conversion event
- Pages per session: How deeply visitors explore your site
- Average engagement time: More accurate than the old “time on page” — measures actual active time
- Top pages by engagement: Which content captures and holds attention
- Exit pages: Where visitors leave (and whether that exit is expected or problematic)
- Site search queries: What visitors cannot find through navigation
Behavior analysis is where audience segmentation becomes critical. Your aggregate behavior metrics are averages of very different user groups. A first-time visitor from organic search behaves differently than a returning visitor from an email campaign. Segment before you analyze.
Stage 3: Conversion — Does Traffic Drive Business Outcomes?
Conversion analysis connects traffic to revenue. This is where most analytics setups fall short — they track page views and sessions but never define or measure the actions that matter to the business.
Key conversion metrics:
- Conversion rate (macro): Purchases, signups, demo requests — the primary business action
- Conversion rate (micro): Newsletter signups, content downloads, account creation — leading indicators
- Revenue per session: Total revenue divided by sessions, broken down by channel and segment
- Conversion path length: How many touchpoints before conversion
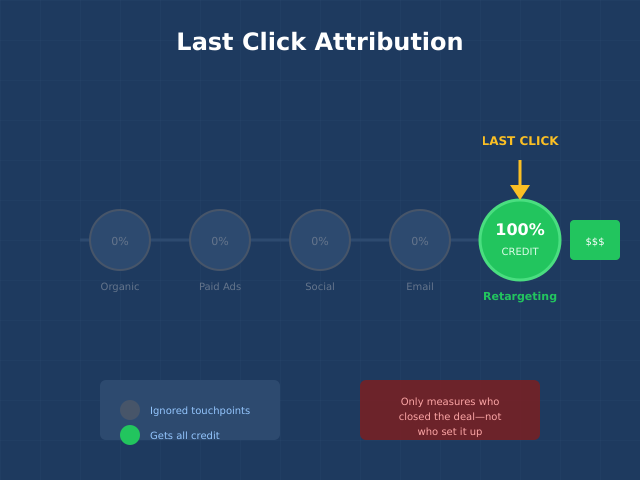
- Assisted conversions: Which channels and pages assist conversions without being the last click
Understanding your full conversion funnel reveals where visitors drop off between arrival and conversion. A 3% overall conversion rate might mask a 60% drop-off at the pricing page — a specific, fixable problem that aggregated metrics hide.
Key Metrics and What They Actually Tell You
Not all metrics are created equal. Some drive decisions. Others just fill dashboards. Here is a clear breakdown of what each common metric actually reveals — and what it does not.
| Metric | What It Tells You | What It Does NOT Tell You | Actionability |
|---|---|---|---|
| Total sessions | Site-level traffic volume and trends | Traffic quality, revenue impact | Low (without context) |
| Engagement rate | Whether visitors find value | Why they engage or disengage | Medium |
| Conversion rate | How effectively you convert visitors | Which elements drive or block conversion | High |
| Revenue per session | Dollar value of each visit | Customer lifetime value, retention | High |
| Bounce rate | Single-page sessions (replaced by engagement rate in GA4) | Whether the visit was successful (blog readers often “bounce” after finding their answer) | Low |
| Pages per session | Exploration depth | Whether deep exploration indicates interest or confusion | Medium |
| New vs. returning | Audience growth vs. retention | Identity is cookie-based; same person on two devices counts as two new users | Medium |
Focus your regular reporting on the high-actionability metrics: conversion rate, revenue per session, and engagement rate by segment. Track volume metrics for trend detection but do not optimize for them directly. More on identifying the right metrics in our guide to marketing KPIs worth tracking.

Segmentation Approaches for Traffic Analysis
Aggregate data lies. Your site-wide conversion rate is an average of segments that may differ by 10x. Segmentation reveals the patterns hidden in averages.
Channel Segmentation
The most fundamental segmentation. Compare behavior and conversion metrics across acquisition channels. You will typically find that organic search traffic has higher intent and better engagement than social media traffic, while email traffic converts at the highest rate because those visitors already know you.
Device Segmentation
Mobile and desktop users often have dramatically different behavior patterns. If mobile conversion rates are significantly lower than desktop, you likely have UX problems on mobile — not a traffic quality issue. Device-specific analysis prevents you from misdiagnosing mobile UX issues as traffic problems.
Geographic Segmentation
Essential for businesses considering market expansion. Traffic from countries where you do not ship or do not serve creates noise in your metrics. Filter to relevant geographies before drawing conclusions about overall performance.
New vs. Returning Visitors
New visitors test your first impression. Returning visitors test your ability to retain. If new visitor engagement is low, your landing pages or content need work. If returning visitor frequency is declining, your product or content freshness may be the issue. The customer journey looks fundamentally different for these two groups.
Intent-Based Segmentation
Group visitors by intent signals: informational visitors (reading blog content), comparison visitors (viewing pricing and feature pages), and transactional visitors (adding to cart, starting trials). Each group needs different content and different conversion paths. This is the most powerful segmentation approach, but it requires custom event tracking to implement properly.
Traffic Benchmarks by Industry
Benchmarks are useful as directional indicators — not as targets. Your own month-over-month trends are more meaningful than industry averages. That said, these benchmarks help you identify where you significantly underperform your industry peers.
| Industry | Avg. Engagement Rate | Avg. Pages/Session | Avg. Conversion Rate | Avg. Session Duration |
|---|---|---|---|---|
| E-commerce | 55-65% | 3.5-5.0 | 1.5-3.0% | 2:30-4:00 |
| B2B SaaS | 60-70% | 2.5-4.0 | 2.0-5.0% | 2:00-3:30 |
| Media/Publishing | 50-60% | 1.5-2.5 | 0.5-2.0% (subscriptions) | 1:30-3:00 |
| Financial Services | 55-65% | 3.0-4.5 | 1.0-3.0% | 3:00-5:00 |
| Healthcare | 55-65% | 2.0-3.5 | 1.0-3.0% | 2:00-3:30 |
Sources: Statista e-commerce benchmarks, Contentsquare digital experience benchmarks, and aggregate data from multiple industry reports.
Tools for Website Traffic Analysis
Your choice of analytics tool shapes what you can measure and how quickly you can act. Here is how the major options compare for traffic analysis specifically.
| Tool | Best For | Traffic Analysis Strengths | Limitations | Price |
|---|---|---|---|---|
| Google Analytics 4 | Most businesses | Free, powerful segmentation, attribution modeling | Steep learning curve, sampled data at scale | Free / GA360 from $50K/yr |
| Plausible | Privacy-focused teams | Clean UI, cookieless, no consent banners needed | Limited segmentation, no funnel analysis | From $9/mo |
| Matomo | Data ownership | Full data control, GA-like feature set, self-hostable | Requires maintenance if self-hosted | Free (self-hosted) / from $23/mo (cloud) |
| Mixpanel | Product analytics | Event-based analysis, cohort analysis, funnels | Not designed for marketing traffic analysis | Free tier / from $20/mo |
| Adobe Analytics | Enterprise | Advanced segmentation, real-time, unsampled data | Expensive, requires dedicated analyst | Custom pricing |
For most businesses, GA4 supplemented with a cookieless tracking solution provides the best balance of capability and cost. GA4 handles deep analysis while cookieless tools capture the visitors who block Google Analytics.
Identifying Actionable Patterns vs. Vanity Metrics
The hardest skill in traffic analysis is distinguishing between patterns that demand action and noise that demands nothing. Here is a practical decision framework.
A Pattern Is Actionable When:
- It connects to a business outcome. A 20% drop in organic traffic to product pages is actionable because product pages drive revenue. A 20% drop in traffic to your “About” page is worth noting but unlikely to warrant immediate action.
- The cause is identifiable. If conversion rates dropped 15% and you can trace it to a site redesign, pricing change, or broken checkout flow, you have an actionable pattern. If conversion rates fluctuate randomly by 2-3% monthly, that is normal variance.
- You can influence it. A traffic drop caused by a Google algorithm update is partially actionable (you can improve content quality). A traffic drop caused by seasonality is not — you can only plan for it.
- The impact is statistically significant. Small fluctuations in low-traffic segments are noise. Use statistical significance calculators before declaring a trend.
Vanity Metrics to Deprioritize
- Total page views without engagement or conversion context
- Social media followers that do not correlate with referral traffic or conversions
- Time on page averages that include abandoned tabs inflating the numbers
- Raw session counts without channel or segment breakdown
- “Unique visitors” counts that are inflated by cookie deletion and multi-device usage
This does not mean vanity metrics are useless — they can be early warning signals. But they should never be the primary metrics in your traffic analysis reports or the basis for strategic decisions.
Building a Traffic Analysis Workflow
A consistent analysis workflow ensures you catch problems early and capitalize on opportunities. Here is a practical cadence.
- Daily (5 minutes): Check for anomalies — sudden traffic drops or spikes, broken tracking, error pages receiving traffic
- Weekly (30 minutes): Review channel performance, top-performing and declining pages, conversion rate trends by segment
- Monthly (2-3 hours): Full framework analysis (acquisition → behavior → conversion), benchmark comparison, content performance review, segment-level analysis
- Quarterly (half day): Strategic review — channel mix optimization, audience trends, competitive analysis, annual forecast updates
Automate what you can. Set up alerts in GA4 for traffic drops exceeding 20%, conversion rate changes exceeding 15%, and error page spikes. Automated anomaly detection catches problems faster than manual reviews.
Common Mistakes
These errors consistently lead to bad decisions based on misleading data. Avoid them to ensure your traffic analysis actually improves outcomes.
1. Analyzing Aggregated Data Without Segmentation
Site-wide averages are almost always misleading. A 3% conversion rate might be a blend of 8% from email traffic and 0.5% from social traffic. If you optimize for the average, you make suboptimal decisions for both segments. Always segment before analyzing.
2. Confusing Correlation With Causation
Traffic went up the same month you redesigned the homepage. Was it the redesign? Or was it seasonal demand? Or a competitor’s site going down? Traffic analysis identifies correlations. Establishing causation requires controlled experiments (A/B tests) or careful analysis of confounding variables.
3. Ignoring Data Quality Issues
Bot traffic, internal traffic, duplicate tracking codes, and misconfigured events corrupt your data silently. Before any analysis, verify data quality. The common analytics mistakes that plague most implementations make traffic analysis unreliable from the start.
4. Optimizing for Volume Instead of Value
More traffic is not always better. If you double traffic by ranking for irrelevant keywords, your conversion rate drops, your engagement metrics decline, and your server costs increase — all without generating additional revenue. Optimize for high-intent traffic that converts, not total session counts.
5. Not Setting Up Proper Tracking Before Analyzing
You cannot analyze what you do not measure. Many businesses try to extract insights from default GA4 setups that only track page views. Invest in proper event tracking, conversion setup, and server-side tracking before expecting meaningful analysis.
Continue Learning
Strengthen your traffic analysis skills with these related guides:
- Analytics Audit Checklist: 15 Issues That Silently Break Your Data
- Conversion Funnel Analysis: Find Where You Lose Customers
- Audience Segmentation: The Complete Guide to Targeting the Right Users
- 18 Marketing KPIs Worth Tracking and 5 Metrics to Skip
- Cookieless Tracking: How to Measure Traffic Without Cookies
Bottom Line
Website traffic analysis is not about watching numbers — it is about asking the right questions and finding answers that drive decisions. The acquisition → behavior → conversion framework gives you a structured approach to analysis that connects traffic patterns to business outcomes.
Start with proper segmentation. Compare channels, devices, and visitor types rather than analyzing aggregated data. Focus on high-actionability metrics like conversion rate and revenue per session rather than vanity metrics like total page views. Build a consistent analysis cadence that catches anomalies early and identifies trends before your competitors do.
The companies that turn traffic data into growth are not the ones with the most sophisticated tools — they are the ones with clear frameworks, clean data, and the discipline to act on what the data reveals. That combination is more powerful than any dashboard.