Analytics for Small Business: What to Track and What to Ignore
Small businesses do not need enterprise analytics. They need to know if their website is working — whether visitors become customers, which marketing channels are worth the spend, and where the biggest opportunities hide. That is it.
The analytics industry has made measurement feel complicated. Dashboards with 50 metrics, attribution models with Greek letters, data warehouses that cost more than your rent. Most of it is irrelevant for a business with a 5-person team and a $3,000 monthly marketing budget. Analytics for small business should take 30 minutes to set up and 15 minutes per week to review.
This guide strips analytics to what actually matters for small businesses: the five metrics that drive decisions, the free tools that capture them, a setup you can complete this afternoon, and a clear line between what to track and what to ignore.

Minimal Viable Analytics: What You Actually Need
A minimal viable analytics setup answers three questions:
- Are people finding my website? (Traffic volume and sources)
- Are they doing what I want them to do? (Conversions)
- Where are they getting stuck or leaving? (Drop-off points)
If your analytics setup answers these three questions reliably, you have enough data to make smart marketing decisions. Everything beyond this is optimization — valuable eventually, but not on day one.
Here is the minimum setup:
- One analytics tool installed on every page (GA4, Plausible, or Umami)
- Conversion tracking for your primary business action (purchase, form submission, phone call, booking)
- Google Search Console connected (free, shows which search queries bring traffic)
- A weekly 15-minute review of the five metrics below
That is it. No data warehouse. No CDP. No attribution modeling. Those come later, if and when your business reaches a scale that justifies them.
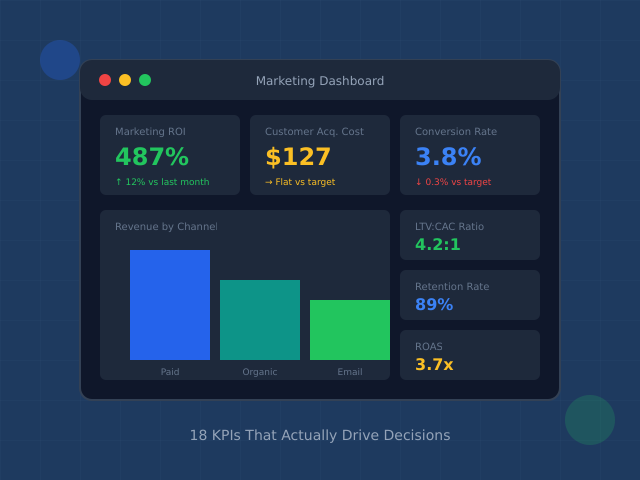
The 5 Metrics That Actually Matter for Small Business
Out of hundreds of available metrics, these five provide the information small businesses need to make decisions. Master these before adding anything else to your dashboard.
1. Traffic by Source
Not total traffic — traffic by source. Knowing you had 2,000 visitors last month is mildly interesting. Knowing that 800 came from Google, 400 from Instagram, 300 from direct, 250 from referrals, and 250 from email is actionable. It tells you which marketing channels are working.
For small businesses, the source breakdown reveals whether your time investment matches your traffic results. If you spend 10 hours per week on Instagram but it generates 5% of your traffic while Google search generates 40% with zero active effort, your time allocation is wrong.
2. Conversion Rate
Your conversion rate is the percentage of visitors who complete your primary business action. For an e-commerce store, that is a purchase. For a service business, it is a form submission or phone call. For a restaurant, it might be a reservation booking.
Benchmark: Most small business websites convert at 1-3%. If you are below 1%, your website has usability or messaging problems. If you are above 3%, you are doing well. Above 5%, you likely have a strong landing page or your traffic is highly qualified.
Track conversion rate by source too. A 2% overall conversion rate might hide a 6% rate from Google search and a 0.3% rate from social media — information that should shape where you invest your marketing energy.
3. Top Pages
Know which 10 pages get the most traffic and the most conversions. These are your money pages. They deserve the most attention, the best content, and regular updates. If your contact page is your third most-visited page but has a 40% bounce rate, that is a high-priority fix.
Top pages also reveal customer intent. If “pricing” is your most-visited page, visitors are ready to buy and want to understand costs. If “how it works” is the top page, visitors need more education before purchasing. Align your content strategy with what your top pages reveal about visitor needs.
4. Engagement Rate (or Bounce Rate)
GA4 uses engagement rate (the inverse of bounce rate). It measures the percentage of visitors who interact meaningfully with your site — staying 10+ seconds, viewing 2+ pages, or triggering a conversion event. According to Littledata benchmarks, the average website bounce rate is around 47%, meaning roughly half your visitors leave without meaningful interaction.
A low engagement rate on key pages signals problems: slow load times, confusing navigation, content that does not match what visitors expected, or poor mobile experience. For small businesses, fixing the engagement rate on your top 5 pages typically delivers more impact than any other optimization.
5. Revenue or Lead Value Per Channel
If you can connect your analytics to revenue (e-commerce tracking or lead value assignment), this metric answers the ultimate question: which marketing channels make money?
For e-commerce, GA4 tracks revenue directly. For service businesses, assign an estimated value to each lead based on your close rate and average deal size. If 1 in 5 leads becomes a $2,000 customer, each lead is worth approximately $400. Multiply by leads per channel to get channel value.
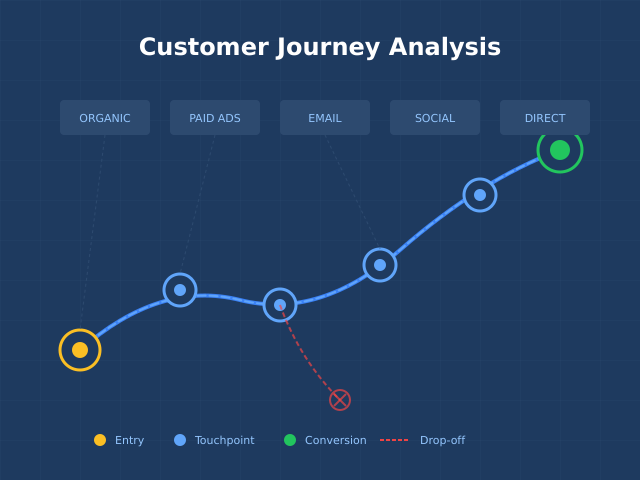
Understanding the conversion funnel for each channel helps you identify not just which channels bring revenue, but where you lose potential customers along the way.
Free Tools Comparison: GA4 vs. Plausible CE vs. Umami
You do not need to pay for analytics as a small business. These three free options cover everything in the minimal viable setup described above. The right choice depends on your technical comfort level and privacy requirements.
| Feature | GA4 (Free) | Plausible CE (Self-Hosted) | Umami (Self-Hosted) |
|---|---|---|---|
| Cost | Free | Free (need server ~$5/mo) | Free (need server ~$5/mo) |
| Setup difficulty | Medium | Medium (Docker) | Easy (one-click deploy) |
| Learning curve | Steep | Very low | Very low |
| Cookies required | Yes (consent needed) | No | No |
| GDPR consent banner | Required | Not required | Not required |
| Conversion tracking | Advanced (events + e-commerce) | Basic (custom events) | Basic (custom events) |
| Traffic source tracking | Detailed (with UTMs) | Good | Good |
| Real-time view | Yes | Yes | Yes |
| E-commerce tracking | Full support | No | No |
| Data ownership | Google owns it | You own it | You own it |
| Integration ecosystem | Extensive | Limited | Limited |
| Best for | E-commerce, advanced needs | Content sites, privacy focus | Simple sites, privacy focus |
Recommendation by business type:
- E-commerce store: GA4. You need e-commerce tracking, and the free alternatives do not support it well enough.
- Service business (local): Plausible CE or Umami. Simple, privacy-friendly, no cookie banner needed. See our Plausible review for a detailed assessment.
- Content/blog site: Plausible CE or Umami. Traffic sources and top pages are the main metrics you need.
- SaaS startup: GA4 for marketing site + Mixpanel or PostHog (free tiers) for product analytics.

The 30-Minute Setup Guide
Here is a complete analytics setup you can implement in 30 minutes. This guide uses GA4, but the steps are conceptually identical for Plausible or Umami.
Minutes 1-10: Install Your Analytics Tool
- Create a GA4 account at analytics.google.com
- Create a property for your website
- Copy the measurement ID (starts with G-)
- Add the tracking code to your website. If you use WordPress, install the “Site Kit by Google” plugin or add the code to your theme’s header. If you use Shopify, Squarespace, or Wix, paste the measurement ID in the built-in analytics integration.
- Verify data is flowing by visiting your site and checking GA4’s Realtime report
Minutes 10-20: Set Up Conversion Tracking
- Identify your primary conversion action (purchase, form submission, phone call click, booking)
- In GA4, go to Admin → Events → Create Event
- For form submissions: Create an event that fires when visitors reach your “thank you” page (page_view event where page_location contains “/thank-you” or “/confirmation”)
- For phone calls: Track clicks on your phone number link (click event on tel: links)
- Mark your new event as a Key Event (conversion) in Admin → Key Events
Minutes 20-30: Connect Google Search Console
- Go to search.google.com/search-console
- Add your website property
- Verify ownership (if you installed GA4 via Site Kit, it may already be verified)
- In GA4, go to Admin → Search Console Links → Link
- Connect your Search Console property to GA4
That is it. You now have traffic tracking, conversion tracking, and search query data. Give it 48 hours to collect meaningful data, then start your weekly reviews.
What to Ignore: Vanity Metrics for Small Business
These metrics will appear in your analytics dashboard and tempt you to track them. Resist. They consume attention without informing decisions.
| Vanity Metric | Why It’s Misleading | What to Track Instead |
|---|---|---|
| Total page views | Inflated by bots, refreshes, and single users browsing multiple pages | Sessions by source |
| Social media followers | Followers ≠ customers. Many accounts are inactive or irrelevant. | Traffic and conversions from social |
| Time on page (average) | Includes abandoned tabs. A “5 minute average” might mean 30 seconds of reading + abandoned tab. | Engagement rate |
| Email list size | A 10,000-person list with 5% open rate is worse than a 1,000-person list with 40% open rate | Email-driven revenue/conversions |
| Domain authority | A third-party estimate, not a Google metric. Does not directly predict rankings. | Actual organic traffic and keyword rankings |
| Total backlinks | Quantity without quality is meaningless. One link from a major publication outweighs 100 directory links. | Referring domains from relevant sites |
The danger of vanity metrics is not that they are tracked — it is that they get optimized for. If your team celebrates hitting 10,000 monthly page views while conversion rate drops from 3% to 1%, you have tripled your traffic and reduced your results. Focus on the metrics that actually connect to business outcomes.
Weekly Analytics Review: 15 Minutes That Matter
A consistent weekly review prevents problems from festering and ensures you notice trends before they become crises. Here is a 15-minute weekly workflow.
- Minutes 1-3: Traffic check. Compare this week’s sessions to last week’s and the same week last month. Any changes greater than 20% warrant investigation.
- Minutes 3-6: Source review. Check traffic by source. Is any channel growing or declining significantly? This is your early warning system for SEO changes, social algorithm shifts, or email deliverability problems.
- Minutes 6-9: Conversion check. How many conversions this week? What is the conversion rate? Compare to your trailing 4-week average. If conversions dropped but traffic did not, something on your site changed — check forms, CTAs, and page load speed.
- Minutes 9-12: Top pages. Review your top 10 pages. Any new pages gaining traction? Any previously strong pages losing traffic? Pages gaining traction deserve content expansion. Pages losing traffic may need updates.
- Minutes 12-15: Action items. Write down 1-3 specific actions based on what you found. “Look into why Google traffic dropped 15%.” “Update the pricing page that has a 75% bounce rate.” “Create more content similar to the blog post that generated 12 leads.”
No action items? That is fine — it means things are running normally. The value of the weekly review is catching the weeks when something is off, not generating busywork every week.
When to Invest in Paid Tools
Free analytics tools serve most small businesses well. But there are clear triggers that indicate when upgrading to paid tools generates positive ROI.
Invest When You Hit These Thresholds
- Marketing spend exceeds $2,000/month. At this level, better attribution modeling pays for itself by revealing which spend is wasted.
- You run multiple marketing channels simultaneously. When organic, paid, email, and social all contribute revenue, understanding the interplay between channels becomes valuable enough to justify paid analytics.
- Your website generates $10,000+/month in revenue. A 5% improvement from better analytics on a $10K/month business is $500/month — more than enough to cover premium tool costs.
- You have 3+ team members accessing analytics. Paid tools offer better collaboration, role-based access, and saved reports that improve team efficiency.
- Free tools cannot track your specific conversion events. Complex multi-step funnels, phone call tracking, and offline conversion import typically require paid solutions.
Recommended Paid Upgrades by Priority
- First upgrade: Heatmap tool ($39-99/month). Hotjar or Microsoft Clarity (free). Shows where visitors click, how far they scroll, and where they get confused. Immediate ROI from fixing UX issues on key pages.
- Second upgrade: SEO tool ($99-199/month). Ahrefs or Semrush. Reveals keyword opportunities, competitor strategies, and technical SEO issues. Essential once organic traffic is a primary channel.
- Third upgrade: Email analytics ($50-150/month). Your email platform’s built-in analytics (Mailchimp, ConvertKit, etc.) combined with proper UTM tracking reveals email’s full contribution to revenue.
- Fourth upgrade: Call tracking ($45-100/month). CallRail or similar. For service businesses where phone calls are a primary conversion, this connects the dots between marketing and revenue.
Do not skip these upgrades in order. Each builds on the previous one. And before investing in any paid tool, make sure your free analytics setup is clean and correctly configured. Paid tools analyzing dirty data produce expensive garbage.
Common Mistakes
Small businesses make predictable analytics mistakes. Avoiding these saves time, money, and bad marketing decisions.
1. Not Setting Up Conversion Tracking
The single most common mistake. Installing GA4 without defining and tracking conversions gives you traffic data but no business data. You can see that 2,000 people visited your site but have no idea how many contacted you, purchased, or booked an appointment. Always set up at least one conversion event during initial installation.
2. Overcomplicating the Setup
Installing GA4, Hotjar, Clicky, Facebook Pixel, LinkedIn Insight, and a session recording tool on day one creates tracking conflicts, slows your site, and generates more data than you can possibly use. Start with one analytics tool. Add others only when you have a specific question that your current tool cannot answer.
3. Checking Analytics Daily Without Acting
Daily analytics checks are only useful if you act on what you find. For most small businesses, weekly reviews are the right cadence. Daily checks without a framework lead to analysis paralysis and reactive decisions based on normal traffic fluctuations. The common analytics pitfalls guide covers more ways this goes wrong.
4. Ignoring Mobile Performance
Over 60% of web traffic comes from mobile devices. If your mobile conversion rate is significantly lower than desktop, you are leaving money on the table. Segment your analytics by device and fix mobile-specific issues before spending money on more traffic. A mobile-friendly site with 1,000 visitors outperforms a desktop-only experience with 3,000.
5. Not Filtering Internal Traffic
If you and your team visit your own site regularly (checking content, testing changes, processing orders), your analytics data includes internal visits. For a small business with 500 monthly visitors, 50 internal visits represent 10% of your data — enough to significantly skew your metrics. Set up an IP filter or use GA4’s internal traffic identification to exclude your own visits.
Continue Learning
Build on your small business analytics foundation with these practical guides:
- Analytics Audit Checklist: 15 Issues That Silently Break Your Data
- Conversion Funnel Analysis: Find Where You Lose Customers
- Cookieless Tracking: How to Measure Traffic Without Cookies
- The Psychology Behind High-Converting Landing Pages
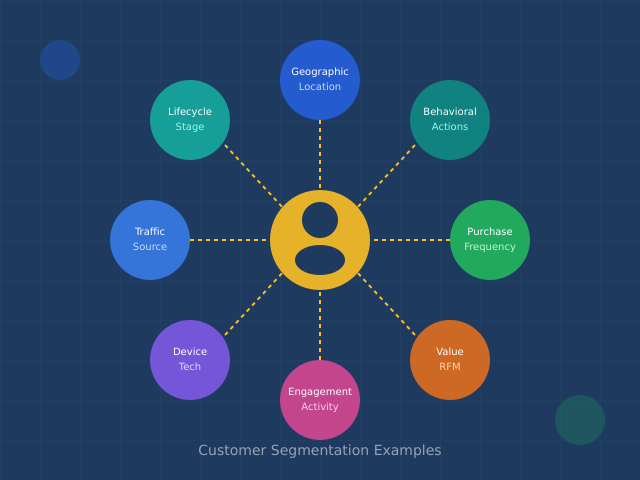
- 12 Customer Segmentation Examples That Drive Real Results
Bottom Line
Small business analytics is not about having the most data — it is about having the right data and the discipline to act on it. Five metrics, one free tool, a 30-minute setup, and a 15-minute weekly review. That is your minimal viable analytics program.
Start with traffic by source, conversion rate, top pages, engagement rate, and revenue per channel. Install GA4 (or Plausible/Umami if privacy is a priority). Set up conversion tracking for your primary business action. Connect Google Search Console. Then review weekly and take 1-3 actions based on what the data tells you.
Upgrade to paid tools only when you hit the revenue and complexity thresholds that make them worthwhile. Until then, free tools plus a consistent review cadence will outperform an expensive analytics stack that nobody understands or uses. Simple analytics, consistently reviewed, beats complex analytics that gathers dust.