Conversion Funnel Analysis: Find Where You Lose Customers
Most businesses track conversions. Few actually understand where they lose them. A conversion funnel analysis reveals exactly that—the specific points where potential customers abandon their journey and the reasons behind each drop-off.
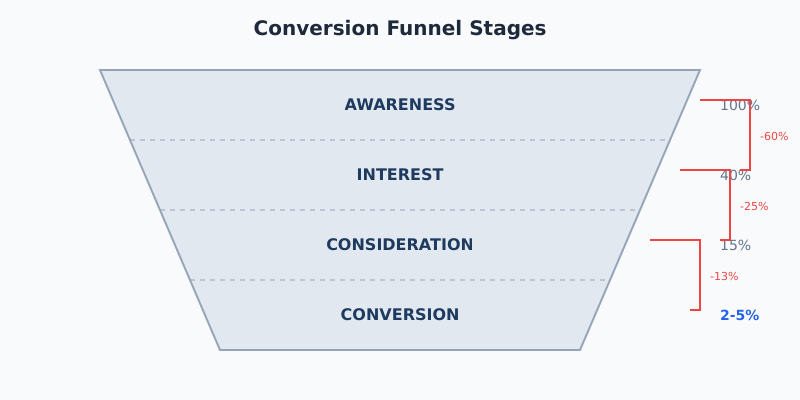
The numbers are stark: average B2B websites convert just 2-5% of visitors. E-commerce hovers around 2-4%. SaaS often struggles below 3%. That means 95-98% of your traffic leaves without converting. The question isn’t whether you’re losing potential customers—it’s where and why.
What Conversion Funnel Analysis Actually Measures
Conversion funnel analysis examines user behavior at each stage of the customer journey, identifying where prospects advance, stall, or exit. Unlike basic conversion tracking that only shows end results, funnel analysis reveals the progression rates between stages—and that’s where actionable insights live.
A typical funnel includes four stages:
| Stage | What Happens | Key Metrics |
|---|---|---|
| Awareness | Visitor discovers your brand | Traffic sources, new vs returning, bounce rate |
| Interest | Visitor engages with content | Pages per session, time on site, scroll depth |
| Consideration | Visitor evaluates your offer | Product views, pricing page visits, comparison engagement |
| Conversion | Visitor completes desired action | Conversion rate, cart completion, form submissions |
The real value emerges when you measure stage-to-stage progression, not just the final conversion. A 3% overall conversion rate tells you little. Knowing that 40% drop off between product view and add-to-cart tells you exactly where to focus.
Conversion Rate Benchmarks by Industry
Before optimizing, you need context. How does your funnel compare to industry standards? Here’s what the 2025-2026 benchmark data shows:
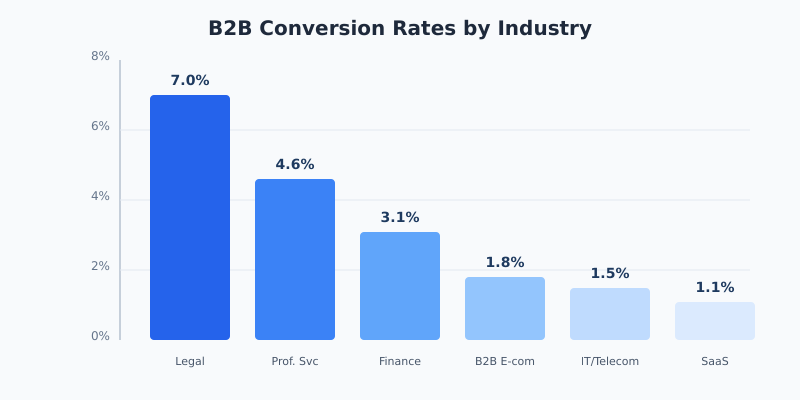
B2B Conversion Benchmarks
| Industry | Average Conversion Rate |
|---|---|
| Legal Services | 7.0% |
| Professional Services | 4.6% |
| Finance | 3.1% |
| B2B E-commerce | 1.8% |
| IT / Telecom | 1.5% |
| SaaS | 1.1% |
E-commerce Benchmarks
| Metric | Average | Top Performers |
|---|---|---|
| Overall conversion rate | 1.9-2.5% | 3%+ |
| Add-to-cart rate | 7.5% | 10%+ |
| Cart completion rate | 25-30% | 40%+ |
| Mobile conversion | 1.8% | 2.5%+ |
| Desktop conversion | 3.9% | 5%+ |
Notice the gap between add-to-cart (7.5%) and overall conversion (1.9-2.5%). That means 70-75% of carts are abandoned. This single insight points to a major optimization opportunity that raw conversion data alone wouldn’t reveal.
Funnel Stage Benchmarks: Where Drop-offs Happen
Overall conversion rates mask the real story. Stage-by-stage analysis from B2B SaaS funnel research reveals where most businesses actually lose prospects:
| Funnel Transition | Average Rate | Top Quartile |
|---|---|---|
| Visitor → Lead | 2.3% | 5%+ |
| Lead → MQL | 31% | 45%+ |
| MQL → SQL | 13-21% | 30%+ |
| SQL → Opportunity | 30-59% | 65%+ |
| Opportunity → Customer | 22-30% | 40%+ |
The MQL to SQL transition stands out as the most common bottleneck, with average conversion between 13-21%. Research shows that improving this single stage by just 5 percentage points can increase revenue by up to 18%.
Related: The Psychology Behind High-Converting Landing Pages explores the behavioral factors that influence these transition rates.
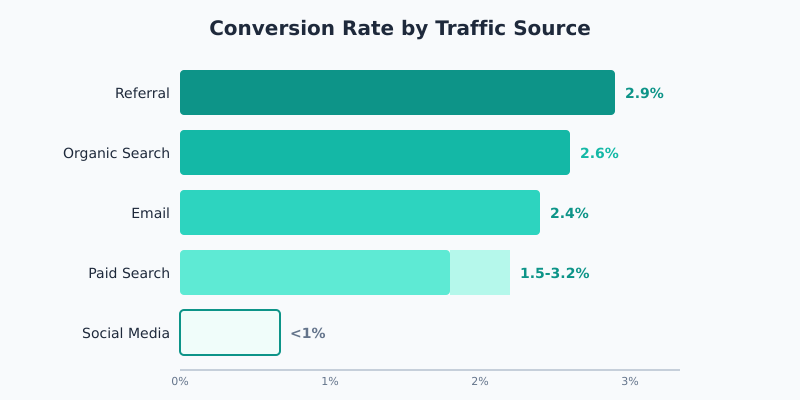
Conversion Rates by Traffic Source
Not all traffic converts equally. Channel analysis often reveals that your best traffic sources aren’t necessarily your largest ones:
| Traffic Source | Avg. Conversion Rate | Quality Indicator |
|---|---|---|
| Referral | 2.9% | Highest intent—pre-qualified by trust |
| Organic Search | 2.6% | Strong intent—actively seeking solutions |
| 2.4% | Warm audience—existing relationship | |
| Paid Search | 1.5-3.2% | Variable—depends on targeting precision |
| Social Media | <1% | Low intent—discovery mode |
Social media often generates high traffic volume with low conversion rates. That’s not necessarily a problem—different channels serve different funnel stages. Social builds awareness; organic search captures intent. The mistake is expecting equal conversion rates across channels with fundamentally different user mindsets.
How to Conduct Funnel Analysis: Step by Step
Step 1: Define Your Funnel Stages
Map the actual user journey, not an idealized version. Track the specific actions that indicate progression:
- E-commerce: Landing → Product View → Add to Cart → Checkout Start → Purchase
- SaaS: Landing → Signup → Activation → Engagement → Conversion
- Lead Gen: Landing → Content Engagement → Form View → Form Start → Submission
Keep funnels to 4-6 stages. More granularity creates noise; fewer stages hide problems.
Step 2: Set Up Event-Based Tracking
Modern analytics requires event tracking, not just pageviews. In GA4, configure events for each funnel stage:
view_item— Product or service page viewsadd_to_cart— Cart additionsbegin_checkout— Checkout initiationpurchase— Completed transactions
For lead generation funnels, create custom events for form interactions, content downloads, and demo requests. The key is tracking actions, not just page visits.
Step 3: Calculate Stage-to-Stage Conversion
For each funnel transition, calculate the progression rate:
Stage Conversion Rate = (Users reaching next stage ÷ Users at current stage) × 100
Example analysis:
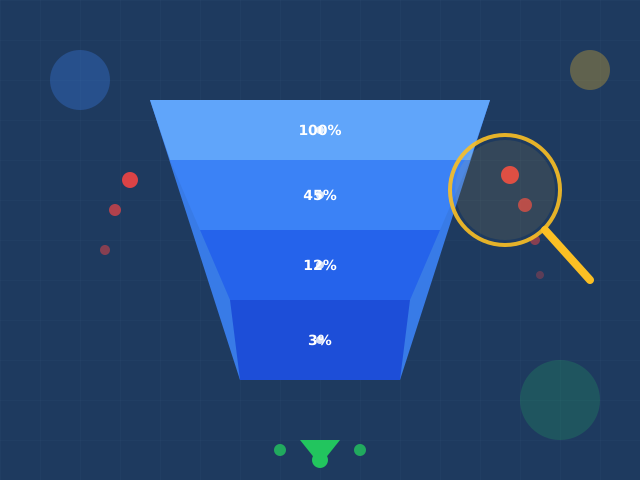
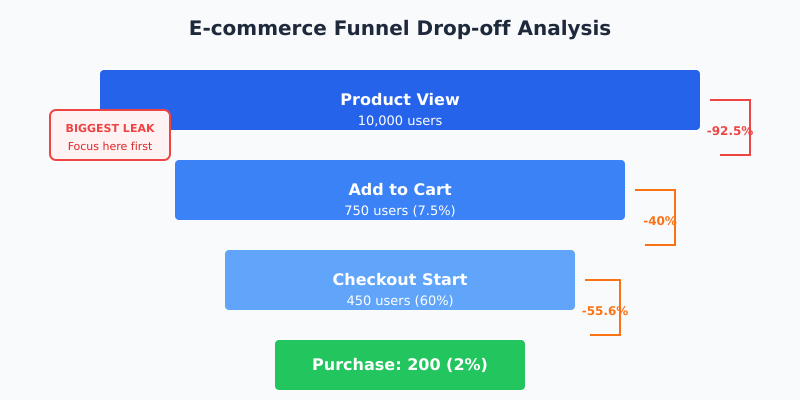
| Stage | Users | Drop-off | Conversion to Next |
|---|---|---|---|
| Product View | 10,000 | — | — |
| Add to Cart | 750 | 9,250 (92.5%) | 7.5% |
| Checkout Start | 450 | 300 (40%) | 60% |
| Purchase | 200 | 250 (55.6%) | 44.4% |
This reveals the biggest leak: 92.5% drop-off between product view and add-to-cart. That’s where optimization efforts should concentrate first.
Step 4: Segment by User Attributes
Aggregate data hides important patterns. Segment your funnel by:
- Device type: Mobile typically converts 50% lower than desktop
- Traffic source: Referral vs. social have fundamentally different intent
- User type: New visitors vs. returning behave differently
- Geography: Conversion varies significantly by region
A “mobile problem” might actually be a “mobile checkout UX problem.” Segmentation reveals specificity.
Step 5: Identify Drop-off Reasons
Numbers show where users leave. Qualitative data explains why. Combine quantitative analysis with:
- Session recordings: Watch actual user behavior at drop-off points
- Heatmaps: See where attention focuses and where it doesn’t
- Exit surveys: Ask users directly why they’re leaving
- Form analytics: Identify which fields cause abandonment
Related: Digital Marketing Trends 2026 covers emerging approaches to behavioral analytics.
Common Funnel Analysis Mistakes
Analysis quality determines optimization quality. These mistakes lead to misguided efforts:
Mistake 1: Analyzing Too Short a Time Period
Weekly data fluctuates wildly. A “drop” in conversion might just be normal variance. Use minimum 30-day windows for analysis, longer for B2B where sales cycles extend months.
Mistake 2: Ignoring Statistical Significance
Small sample sizes produce unreliable insights. A stage with 50 users showing 10% conversion has a huge margin of error. Before acting on any finding, ensure adequate sample size—typically 1,000+ users per funnel stage for reliable conclusions.
Mistake 3: Optimizing the Wrong Stage
Instinct says optimize the lowest-converting stage. Data often says otherwise. A stage converting at 5% with 10,000 users offers more absolute gain potential than a stage at 2% with 100 users. Calculate absolute impact, not just percentage opportunity.
Mistake 4: Treating All Drop-offs as Problems
Not every exit indicates failure. Users leaving after reading a help article may have found their answer. Visitors bouncing from pricing might be self-qualifying out—exactly what you want. Context determines whether a drop-off represents a problem or proper funnel function.
Mistake 5: Analyzing Without Segmentation
Aggregate data averages away insights. Your mobile checkout might have a critical bug affecting 30% of users while desktop works perfectly. Without device segmentation, you’d see only a slightly depressed conversion rate and miss the actual problem entirely.
Optimization Priorities by Funnel Stage
Different stages require different approaches:
Top of Funnel: Awareness → Interest
Goal: Increase engagement rate and reduce bounce
- Match landing page content to traffic source intent
- Improve page load speed (each second of delay reduces conversion by 7%)
- Clarify value proposition within first viewport
- Remove distractions and competing calls-to-action
Target metric: Engagement rate above 60% for content pages, bounce rate below 50% for landing pages.
Middle of Funnel: Interest → Consideration
Goal: Move engaged visitors toward evaluation
- Create clear pathways from content to product/service pages
- Provide comparison information and social proof
- Address common objections proactively
- Offer low-commitment next steps (email signup, free resources)
Target metric: 15%+ of engaged users viewing product/pricing pages.
Bottom of Funnel: Consideration → Conversion
Goal: Remove friction from the final steps
- Simplify forms—each field removed can increase conversion by 10%
- Add trust signals near conversion points
- Provide multiple payment/contact options
- Implement cart abandonment recovery (email within 1 hour recovers 6.5% of carts)
Target metric: Cart completion above 35% for e-commerce, form completion above 40% for lead gen.
Measuring What Matters: Key Metrics by Business Type
E-commerce Metrics
| Metric | Formula | Benchmark |
|---|---|---|
| Add-to-cart rate | Cart additions ÷ Product views | 7-10% |
| Cart abandonment rate | 1 – (Purchases ÷ Carts created) | 60-70% |
| Checkout completion | Purchases ÷ Checkout starts | 40-50% |
| Revenue per visitor | Total revenue ÷ Total visitors | Varies by AOV |
SaaS Metrics
| Metric | Formula | Benchmark |
|---|---|---|
| Visitor-to-trial | Trial signups ÷ Visitors | 2-5% |
| Trial-to-paid | Paid conversions ÷ Trials | 15-25% |
| Activation rate | Activated users ÷ Signups | 20-40% |
| Time to value | Days from signup to activation | <7 days ideal |
Lead Generation Metrics
| Metric | Formula | Benchmark |
|---|---|---|
| Lead capture rate | Leads ÷ Visitors | 2-5% |
| Lead quality score | SQLs ÷ Total leads | 10-20% |
| Speed to lead | Time from submission to contact | <5 min = 21× better qualification |
| Cost per qualified lead | Marketing spend ÷ SQLs | Varies by industry |
The speed-to-lead stat deserves emphasis: responding within 5 minutes makes you 21 times more likely to qualify a lead compared to responding in 30 minutes. Many companies obsess over generating more leads while neglecting response time—a far higher-leverage optimization.
Tools for Funnel Analysis
Effective funnel analysis requires the right tools for each job:
Quantitative tracking:
- GA4: Event-based funnels, path analysis, audience building
- Mixpanel/Amplitude: Advanced cohort analysis, retention funnels
- Privacy-first options: Plausible, Fathom for basic conversion tracking without cookies
Qualitative insights:
- Hotjar/FullStory: Session recordings, heatmaps, form analytics
- User testing platforms: Direct observation of user behavior
- Survey tools: Exit intent surveys, NPS, post-purchase feedback
For privacy-conscious teams, consider that detailed funnel tracking often requires consent mechanisms. Switching analytics platforms requires careful planning to maintain funnel data continuity.
Continue Learning
Build on funnel analysis with these related resources:
- The Psychology Behind High-Converting Landing Pages — behavioral principles that drive conversion
- Digital Marketing Trends 2026 — emerging analytics approaches and measurement strategies
- Plausible Analytics Review — privacy-first analytics for simpler funnel tracking
Bottom Line
Conversion funnel analysis transforms vague “we need more conversions” into specific “we’re losing 92% of users between product view and add-to-cart.” That specificity enables focused optimization instead of scattered improvements.
Start with benchmarks to understand where you stand. Map your actual user journey, not an assumed one. Track stage-to-stage progression, not just final conversion. Segment ruthlessly to find hidden patterns. And remember: the biggest drop-off point isn’t always the most valuable to fix—absolute impact matters more than percentage opportunity.
The companies seeing 11%+ conversion rates aren’t using secret tactics. They’re analyzing their funnels more carefully, identifying specific friction points, and addressing them systematically. The data is there. You just need to look at it the right way.