When you switch analytics platforms, your live tracking moves over in an afternoon. Your history doesn’t move at all. Universal Analytics and GA4 use incompatible data models, and most privacy-first tools start counting from the day you install them. The years of trends, seasonality, and year-over-year comparisons that justify next quarter’s budget can vanish the moment you flip the switch — unless you extract and store them first.
This guide covers how to preserve historical analytics data before a migration: what you can realistically keep, where to put it, and which export path fits your stack. The work is mostly a one-time extraction. Do it before you decommission the old property, because once a property is deleted the data is gone for good.
Why Historical Data Doesn’t Migrate Automatically
There is no “import old data” button in any analytics platform, and the reason is structural. Universal Analytics organized everything around sessions and the hit types of pageview, event, transaction, and social. GA4 organizes everything around events with parameters. A privacy-first tool like Plausible uses an even simpler model of pageviews and custom events with no user-level identifiers at all.
Because the schemas don’t line up, you can’t replay old sessions into a new system and expect the numbers to match. What you can do is export the aggregated reports and raw rows you care about, store them somewhere durable, and reference them as an archive. Think of it as keeping the old maps rather than rebuilding the old roads.
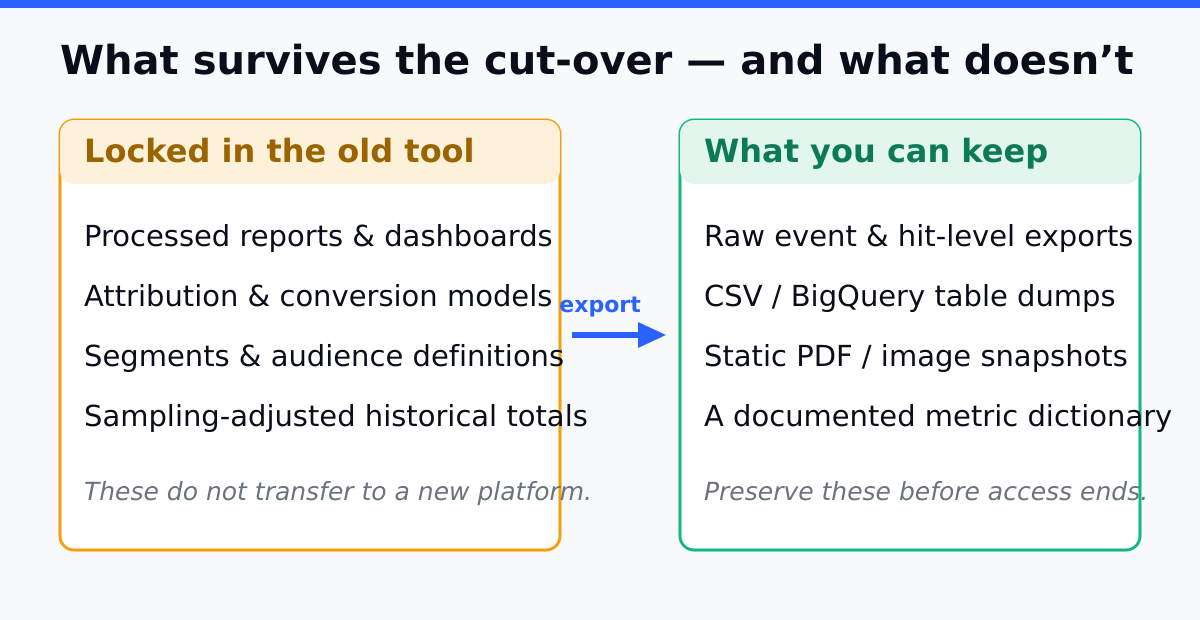
What You Can Realistically Keep
Not every metric is worth preserving, and some can’t be exported at full fidelity. Sort your data into three buckets before you start:
| Bucket | Examples | Export feasibility |
|---|---|---|
| Aggregated reports | Sessions by month, top landing pages, channel mix, conversions by source | High — export as CSV or via API |
| Raw event rows | Individual events with timestamp, page, and parameters | Medium — needs warehouse export |
| User-level paths | Cross-session journeys tied to a client ID | Low — sampled, capped, often unavailable post-cutoff |
Be honest about the third bucket. User-level journey data is the hardest to extract and the least likely to survive a platform change intact. If your reporting depends on month-over-month aggregates — which most reporting does — you’ll preserve nearly everything that matters by focusing on the first two buckets.
Four Export Paths, From Simplest to Most Complete
Pick the lightest path that captures what you need. There’s no prize for over-engineering an archive you’ll glance at twice a year.
Path 1: Manual CSV Export
Open each report you rely on, set the widest date range, and export to CSV or a spreadsheet. This is the fastest route and requires no engineering. The trade-off is that you only capture the reports you remember to export, at the aggregation level the interface offers, and you’ll fight row limits and sampling on large date ranges.
Best for: small sites, blogs, and anyone whose reporting is a handful of monthly trend lines.
Path 2: Reporting API to a Spreadsheet or Database
Both Universal Analytics and GA4 expose reporting APIs. A script can loop over your key dimensions and metrics, page through results, and write them to a database table or a connected sheet. This removes the manual clicking and lets you script consistent monthly snapshots across many dimensions.
The catch is sampling and aggregation limits. The reporting API returns aggregated, sometimes sampled rows — not the raw event stream. For trend archives that’s fine. For row-level forensics it isn’t.
Best for: teams comfortable writing a small extraction script who want many reports captured cleanly.
Path 3: Warehouse Export (BigQuery)
GA4 can stream raw event data to a data warehouse, where each row is a single event with its full parameter set. This is the highest-fidelity archive available: no sampling, every event, queryable with SQL for as long as you keep the tables.
The important constraint is timing. The warehouse export only contains data from the day you enabled it forward — it does not backfill. If preserving raw history matters to you, turn on the warehouse export as early as possible, ideally weeks before you plan to cut over, so the archive has real depth by migration day.
- Link your analytics property to a warehouse project.
- Enable the daily (and optionally streaming) export.
- Confirm tables start populating with one row per event.
- Write a few validation queries to confirm event counts roughly match the analytics interface.
Best for: e-commerce and product teams who need raw, unsampled history for cohort analysis or audits long after cutover.
Path 4: Self-Hosted Cold Storage
If you’re moving to privacy-first analytics partly for data sovereignty, route your exports into storage you control — object storage plus a columnar query engine, or a single embedded analytical database file. The archive then lives entirely on infrastructure you own, with no ongoing dependency on a vendor’s warehouse pricing.
Best for: teams whose migration motivation is control and cost, not just feature fit.
A Pre-Cutover Preservation Checklist
Run this list before you decommission the old property. The order matters — extraction is irreversible once the source is gone.
- Inventory the reports you actually use. Most teams rely on five to ten recurring views, not the whole interface.
- Pick the lightest export path that captures those views at the granularity you need.
- Set the widest available date range and confirm the export isn’t silently sampling or truncating.
- Store in two places. One working copy and one cold backup, ideally in different accounts.
- Document the schema. A short note on what each column means saves your future self hours.
- Validate row counts against the interface before you trust the archive.
- Keep the old property read-only for a grace period rather than deleting it immediately.
Common Mistakes
Mistake 1: Waiting Until the Cutover Day
Warehouse exports don’t backfill, and reporting interfaces are slow to page through years of data. Teams that start extracting the morning they cut over discover the raw-history path was closed weeks ago. Fix: enable any forward-looking export the moment migration is on the roadmap.
Mistake 2: Trusting Sampled Reports as Raw Data
Large date ranges in the interface can return sampled, estimated numbers. Archiving those as if they were exact creates a record that quietly disagrees with itself. Fix: use a warehouse export for fidelity, and clearly label any sampled exports as estimates.
Mistake 3: Archiving Everything Instead of What Matters
Trying to preserve every dimension at row level turns a one-afternoon task into a stalled project. Fix: archive the reports your business actually references, then keep one high-fidelity raw export as insurance.
Mistake 4: Deleting the Old Property Too Soon
Once a property is deleted, it’s unrecoverable. There is no support ticket that brings it back. Fix: mark the property read-only and leave it parked for a grace period after you’ve validated your archive.
How Preserved Data Earns Its Keep
An archive is only useful if you reach for it. The most common uses after a migration are year-over-year comparisons, seasonality planning, and answering the inevitable “but what did this look like last year?” question that new analytics can’t answer because it wasn’t installed yet. Your archive bridges that gap.
It’s also your insurance for the parallel-run period. When you run the old and new systems side by side and the numbers diverge — which they always do, because the data models differ — your historical baseline tells you whether a number is genuinely off or just measured differently. That reconciliation is far easier when you can point at what “normal” used to look like.
Continue Learning
Preserving history is one stage of a larger migration. These guides cover the stages around it:
- Mistakes and Pitfalls When Switching Analytics Platforms — the migration errors that lose data, including history.
- Analytics Audit Checklist — verify your tracking is sound before and after the move.
- First-Party Data Strategy — owning the data you collect from here forward.
- Server-Side Tracking — routing future data through infrastructure you control.
- GDPR-Compliant Analytics — retention rules that apply to archived data too.
Bottom Line
Historical analytics data doesn’t follow you to a new platform — you have to carry it yourself, and you have to do it before the old property goes dark. Inventory the reports you genuinely use, choose the lightest export path that captures them, and turn on any raw warehouse export early so it has depth by migration day.
Store the result in two places, validate the row counts, and keep the old property read-only until you trust the archive. The whole effort is a one-time extraction measured in hours. Skipping it costs you years of context the first time someone asks how this quarter compares to the last.